Berkshire County · Egremont, the front page ›
Egremont
MassGIS, NHESP and MassDEP layers as published on 1 November 2026.
This is the ground your town stands on: the land it protects, the species and places that make it what it is, and the weather and water records behind its roads and buildings. Each carries a cost or a constraint that shows up in the budget, and the same records guide the state and FEMA when aid is decided.
Habitat, forest and water
Egremont has 5,014 acres of mapped core habitat, 42% of its land area; 1,733 of those acres are outside any protected land.
Land and Water Index
76 / 10051st of 351 (1 = most forest kept, most core protected, least impaired water)
Rank under other weightings: 39th to 71st.
Stable high: above 55 under every weighting
Core habitat (BioMap)
5,014 acres
42% of its land area · 73rd of 351 · median town 25%
Wetlands, not counting open water
952 acres
8% of its land area · 213th of 351 · median town 9%
Forest, 1971 to 1999
+0.6%
7,336 → 7,383 acres · median town -9.4% · 5th of 351 (1 = most gained)
Assessed water impaired
61%
59 of 69 lake acres; 4.4 of 12.1 river miles · median town 67% · 151st of 351 (1 = least)
| Layer | Acres | Share of land area |
|---|---|---|
| BioMap core habitat | 5,014 | 42% |
| Critical natural landscape | 4,595 | 38% |
| Wetlands (DEP), not counting open water | 952 | 8% |
| Open water in the DEP wetlands layer | 104 | 1% |
| Priority habitat of rare species | 3,310 | 28% |
| Core habitat on protected land | 3,281 | 27% |
| Core habitat outside protected land | 1,733 | 15% |
Of Egremont’s 5,014 acres of core habitat, 3,281 acres (65%) are on protected land — by acres: state 1,535, federal 300, town 314, land trusts and nonprofits 346, conservation or farmland restrictions 355, chapter land 431 — and 1,733 acres are not.
Core habitat and critical natural landscape are BioMap (2022): the places the state's biologists mapped as most important for rare species, intact forest, wetlands and streams. The layers overlap one another; nothing is added across rows. Wetlands are MassDEP's 1:12,000 wetlands layer; ponds and other open water are shown on the map but counted on their own line. Shares are of the municipality's land area (Census 2020), not its water. Acres are mapped acres inside the municipal boundary; coastal flats outside it belong to no town. State land, restrictions and chapter land are on the State land card.
Rare species
NHESP has recorded 42 state-listed species in Egremont: 29 since 2001, and 13 not recorded in 25 years or more.
15 Endangered · 17 Threatened · 10 Special Concern · What the statuses mean ›
 Indiana BatMyotis sodalisEndangered · federally listed
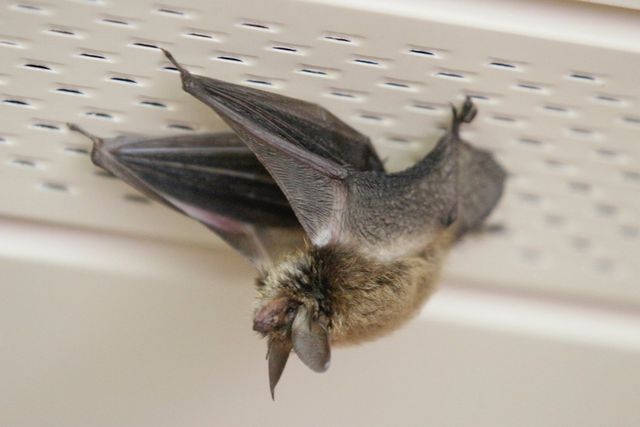 Northern Long-eared BatMyotis septentrionalisEndangered · federally listed
 American BitternBotaurus lentiginosusEndangered
 Eastern Small-footed BatMyotis leibiiEndangered
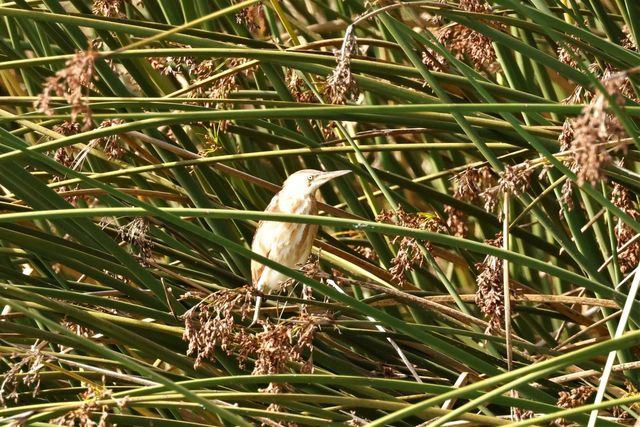 Least BitternIxobrychus exilisEndangered
 Little Brown BatMyotis lucifugusEndangered
ShowHide all 42 rare species recorded in Egremont
| Group | Species | Scientific name | Status | Last recorded |
|---|---|---|---|---|
| Mammals | Eastern Small-footed Bat | Myotis leibii | Endangered | 2016 |
| Mammals | Little Brown Bat | Myotis lucifugus | Endangered | 2016 |
| Mammals | Tricolored Bat | Perimyotis subflavus | Endangered | 2016 |
| Mammals | Northern Long-eared Bat | Myotis septentrionalis | Endangered | 2005 |
| Mammals | Indiana Bat | Myotis sodalis | Endangered | 1935 |
| Birds | American Bittern | Botaurus lentiginosus | Endangered | 2008eBird: Berkshire County, 13 Oct 2026 |
| Birds | Common Gallinule | Gallinula galeata | Special Concern | 2008 |
| Birds | Pied-billed Grebe | Podilymbus podiceps | Endangered | 2007eBird: Berkshire County, 2 Nov 2026 |
| Birds | Least Bittern | Ixobrychus exilis | Endangered | 1991 |
| Birds | Grasshopper Sparrow | Ammodramus savannarum | Threatened | 1978 |
| Birds | King Rail | Rallus elegans | Threatened | 1965 |
| Birds | Sedge Wren | Cistothorus platensis | Endangered | 1955 |
| Reptiles | Wood Turtle | Glyptemys insculpta | Special Concern | 2019 |
| Amphibians | Jefferson Salamander (complex) | Ambystoma jeffersonianum | Special Concern | 2017 |
| Fish | Longnose Sucker | Catostomus catostomus | Special Concern | 1970 |
| Butterflies and moths | Dion Skipper | Euphyes dion | Threatened | 2008 |
| Bees | Parnassia Miner | Andrena parnassiae | Threatened | 2023 |
| Bees | Yellow-banded Bumble Bee | Bombus terricola | Threatened | 2020 |
| Plants | Autumn Coral-root | Corallorhiza odontorhiza | Special Concern | 2023 |
| Plants | Bur Oak | Quercus macrocarpa | Special Concern | 2023 |
| Plants | Canadian Sanicle | Sanicula canadensis | Threatened | 2023 |
| Plants | Culver's-root | Veronicastrum virginicum | Threatened | 2023 |
| Plants | Gattinger's Panic-grass | Panicum philadelphicum ssp. gattingeri | Special Concern | 2023 |
| Plants | Yellow Oak | Quercus muehlenbergii | Threatened | 2021 |
| Plants | Dioecious Sedge | Carex sterilis | Threatened | 2020 |
| Plants | Smooth Rock-cress | Borodinia laevigata | Special Concern | 2020 |
| Plants | Great Blue Lobelia | Lobelia siphilitica | Endangered | 2017 |
| Plants | Slender Cottongrass | Eriophorum gracile | Threatened | 2014 |
| Plants | Fen Sedge | Carex tetanica | Special Concern | 2012 |
| Plants | Capillary Beaksedge | Rhynchospora capillacea | Endangered | 2011 |
| Plants | Drooping Speargrass | Poa saltuensis ssp. languida | Endangered | 2010 |
| Plants | Handsome Sedge | Carex formosa | Threatened | 2010 |
| Plants | New England Northern Reed Grass | Calamagrostis inexpansa | Endangered | 2009 |
| Plants | Hill's Pondweed | Potamogeton hillii | Special Concern | 2008 |
| Plants | Great Laurel | Rhododendron maximum | Threatened | 2004 |
| Plants | Fen Cuckoo-flower | Cardamine dentata | Threatened | 1998 |
| Plants | Hairy Wood-mint | Blephilia hirsuta | Endangered | 1990 |
| Plants | Labrador Bedstraw | Galium labradoricum | Threatened | 1987 |
| Plants | Downy Agrimony | Agrimonia pubescens | Threatened | 1986 |
| Plants | Leafy White Orchid | Platanthera dilatata | Threatened | 1857 |
| Plants | Matted Spike-sedge | Eleocharis intermedia | Threatened | No Date |
| Plants | Narrow-leaved Vervain | Verbena simplex | Endangered | No Date |
Priority Habitat for rare species covers 3,310 acres of Egremont, 28% of its land; the records above are NHESP’s documented observations, kept at town level — the program does not publish locations.
Executive Order 618 (September 2023) directed the Department of Fish and Game to recommend statewide biodiversity conservation goals for 2030, 2040 and 2050; the Biodiversity Goals report (August 2025) set them.
Natural Heritage & Endangered Species Program, Rare Species Viewer, read 4 November 2026 (documented observations by town; historic records older than 25 years included); state list as of 16 August 2024 (321 CMR 10.90). A “most recent” year is the last documented record, not evidence of absence. eBird reports (birders’ sightings, last 30 days, by county; as of 6 November 2026) from eBird, Cornell Lab of Ornithology. Rare species of Massachusetts, the guide ›
What the forest is made of
OakHemlockBeechMapleBirchPineChestnutSpruce and firHickory, ash and other
Which tree is that? Trees of Massachusetts, a pocket field guide ›
Before settlement: the trees surveyors recorded at lot corners and along roads when Egremont was laid out, compiled by Harvard Forest (Cogbill, Burk and Motzkin, 2002). Today: U.S. Forest Service inventory plots pooled by county (Thompson and others, 2013), because single-town plot counts are too small to stand alone. Statewide, oak has fallen from about 45% of surveyed trees to under 20%, maple has risen from about 6% to over 27%, and chestnut is gone.
Then and now
1830: woodland as surveyed for the town’s map (green), meadow and open land (straw), water (blue). Land with no class drawn was farmed or cleared.
2025: MassGIS aerial imagery, same frame.
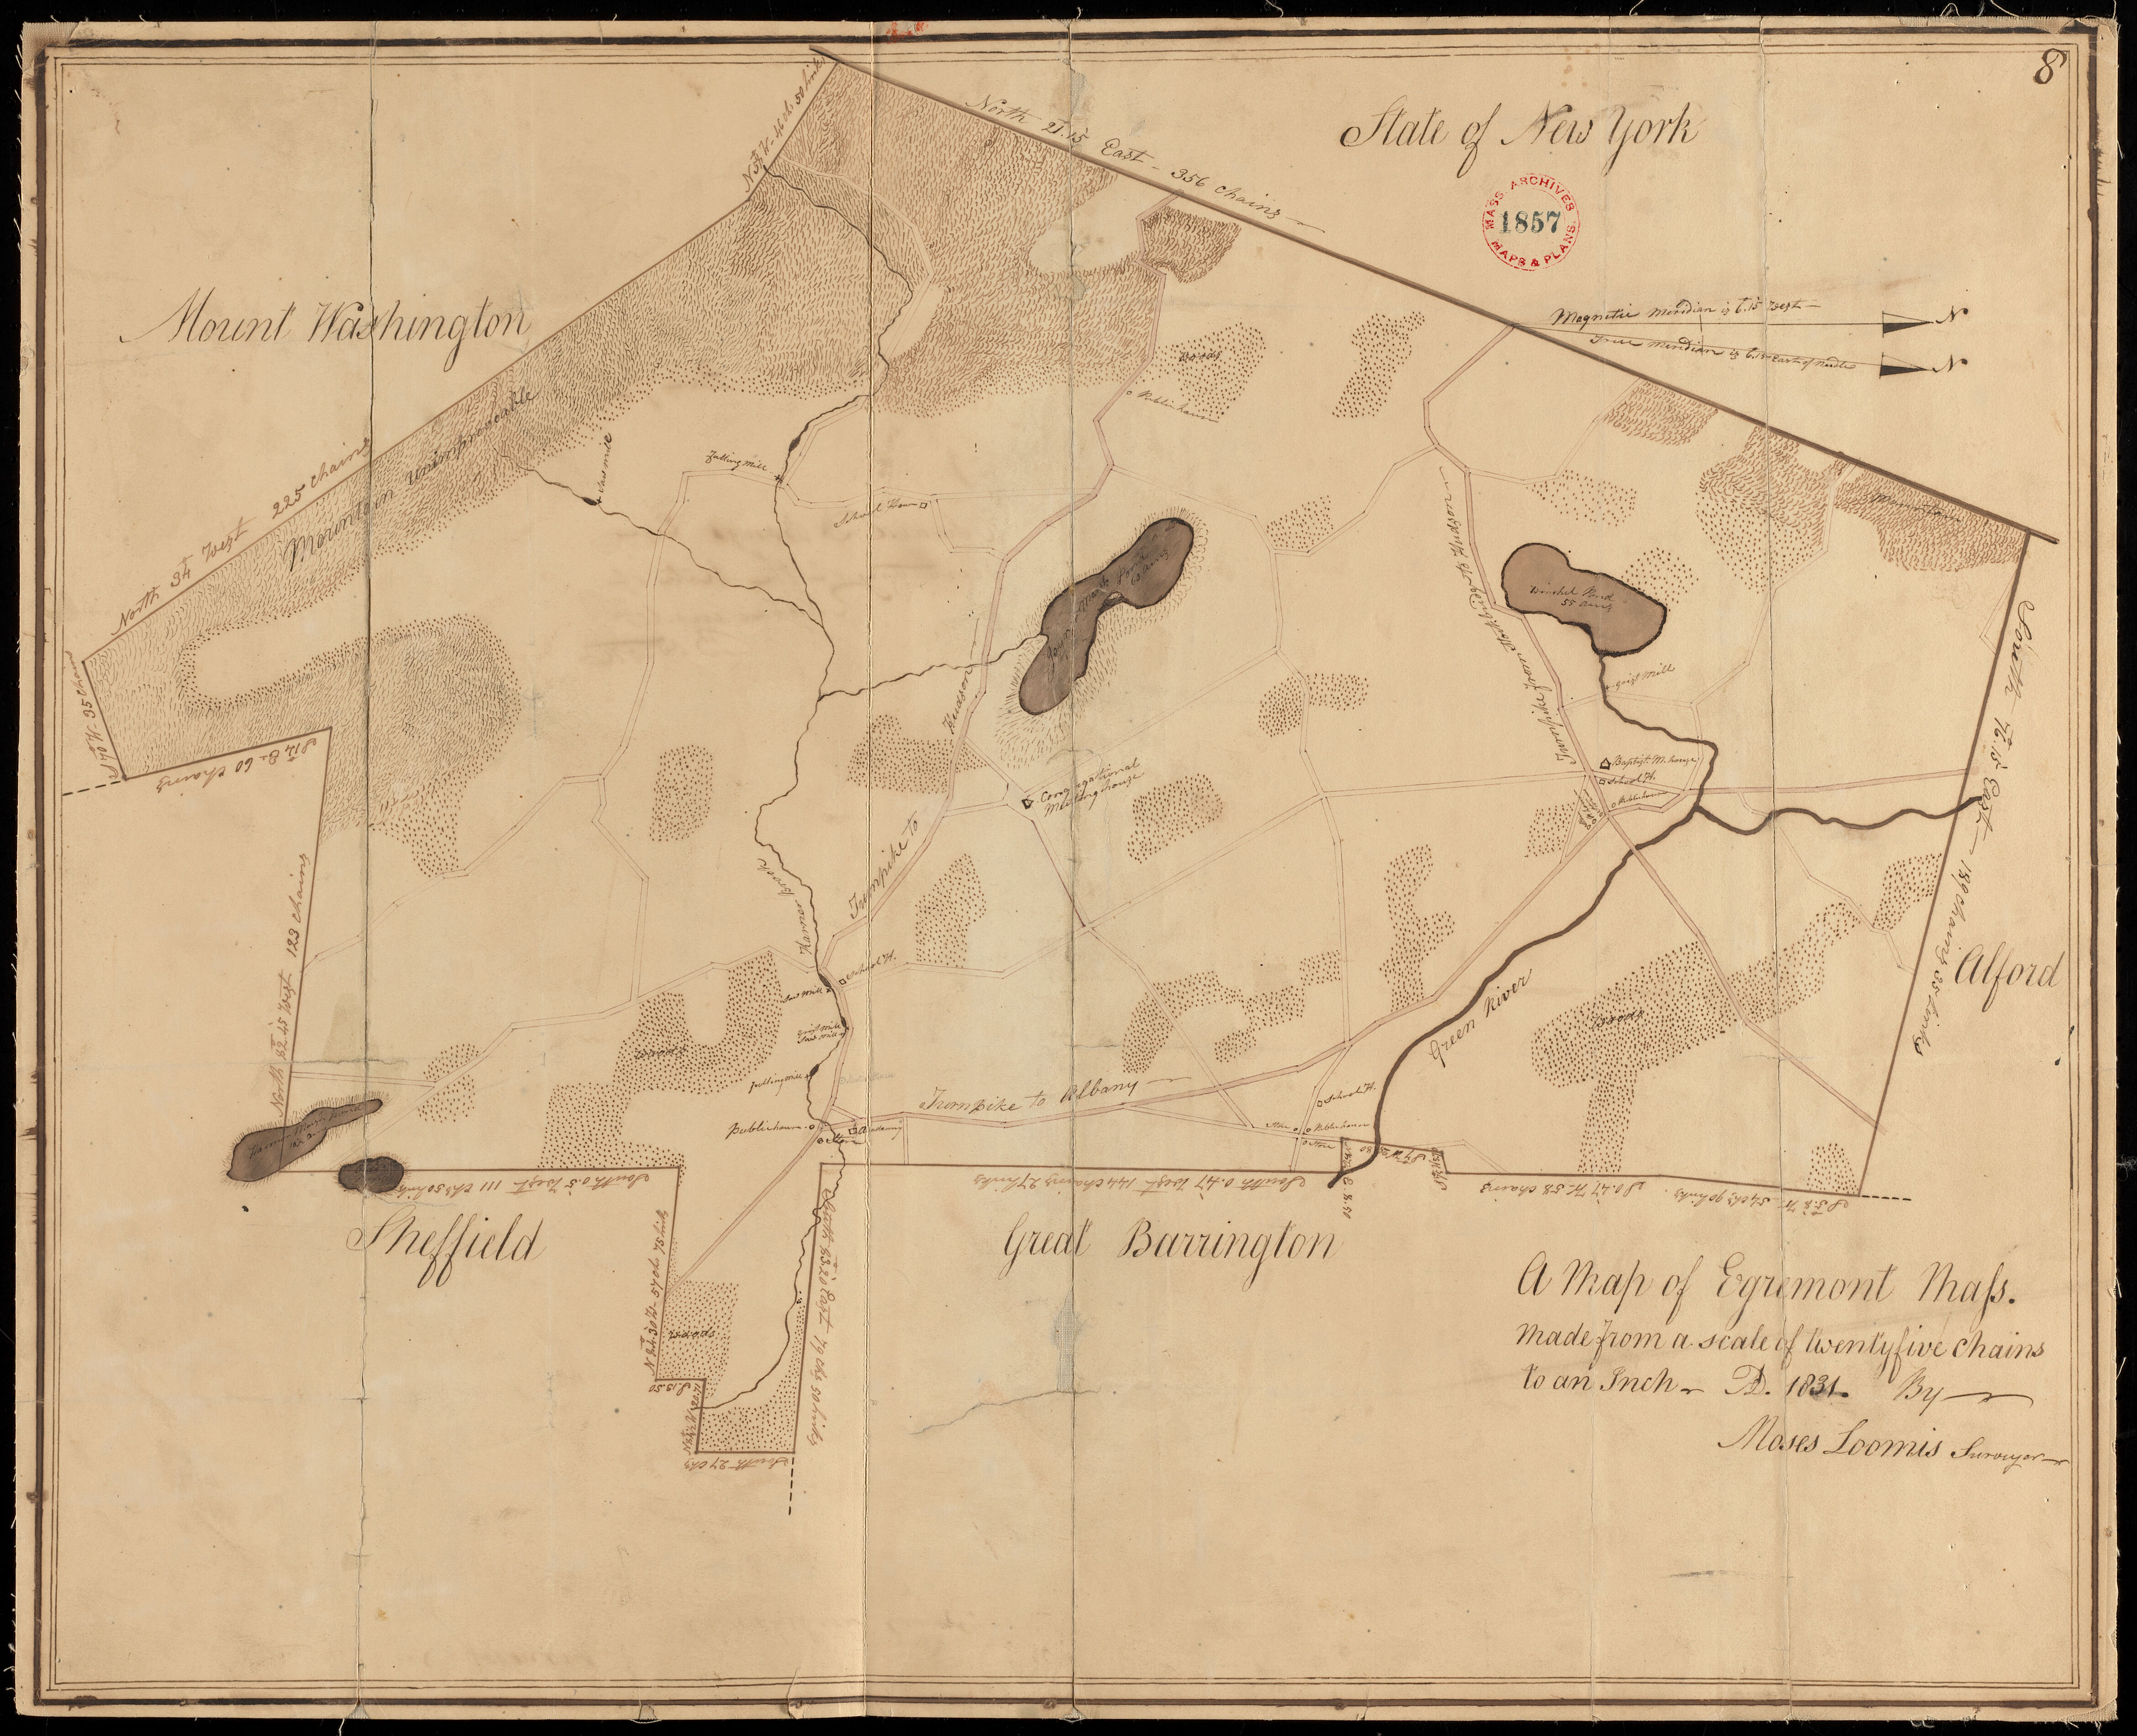
Forest in Egremont: about 1,489 acres of woodland in 1830 (12% of the land area), from the town’s 1830 map as digitized by Harvard Forest and MassGIS; the 1830 maps under-record small woodlots, so that figure is a floor; then 7,336 acres in 1971, 7,218 in 1985 and 7,383 in 1999 (MassGIS land use, one method, forested wetland counted as forest); 8,236 on the 2005 map, made a different way. DCR’s 2021 satellite estimate is 8,556 acres (72%), a different method. Before settlement is a regional estimate: Harvard Forest puts forest cover above 90% of the land before clearing, with openings where people farmed and burned.
Tree cover lost since 2001
Between 2001 and 2024, 241 acres of the 9,674 acres of tree cover Egremont had in 2000 were removed, 2.5% — 62% of the statewide rate (4.0%); the median of the 341 towns with at least 500 acres of tree cover lost 3.3%. 106th of 341 towns with at least 500 acres of tree cover (1 = least lost). The largest single year was 2021, 40 acres. In 2025, the newest year in the record, 3 acres.
| Agent | Years seen | Worst year | Acres that year |
|---|---|---|---|
| Spongy moth | 4 | 2022 | 1,598 |
| White pine needle damage | 4 | 2019 | 1,251 |
| Gall midge | 1 | 2017 | 88 |
| Land use conversion | 1 | 2010 | 88 |
| Drought | 3 | 2003 | 78 |
| Emerald ash borer | 1 | 2025 | 28 |
| Forest tent caterpillar | 1 | 2007 | 24 |
The DCR and U.S. Forest Service aerial detection survey maps visible damage each summer; acres are of the mapped damage polygon, which can include non-forest, not acres of dead trees; one area can be recorded under more than one agent name; entries marked unknown or no data are left out; and the survey’s coverage varies from year to year. Agent names are the survey’s own (spongy moth was formerly called gypsy moth).
Tree cover: Hansen, Potapov, Moore, Hancher and others, Global Forest Change 2000–2025, version 1.13 (University of Maryland GLAD), at 30-metre resolution, counting pixels with at least 30% canopy in 2000. It records any removal of canopy — harvest, development, storms, dieback and defoliation — and does not net out regrowth, so it is tree cover lost, not forest lost. Loss by year was compared with the published version 1.12 for 2001–2024 and matched in every year. Pests: USDA Forest Service Insect and Disease Survey, Region 9, cooperative DCR aerial survey polygons, clipped to the town and dissolved so overlapping polygons of one agent are not double counted.
Water
Of the water MassDEP has assessed in Egremont, 59 of 69 lake acres and 4.4 of 12.1 river miles are on the state's impaired list; these are assessed waters only, not every pond and brook. Causes listed: Curly-Leaf Pondweed; Non-Native Aquatic Plants; Dewatering. Category 4C listings are for causes that are not pollutants, such as invasive plants.
Go deeper
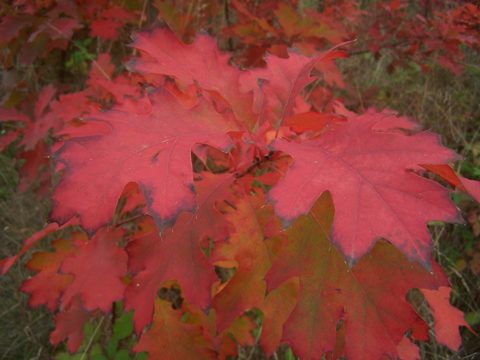

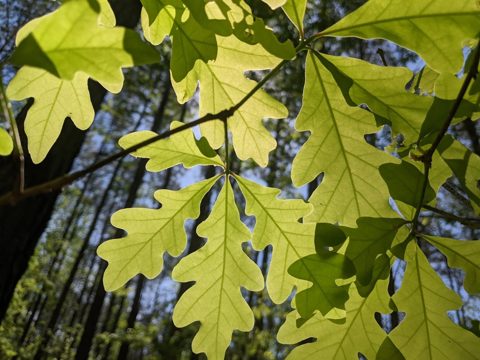
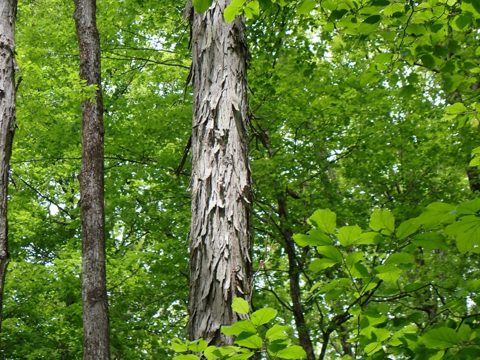
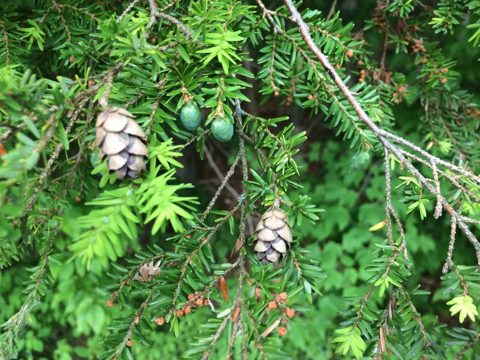 Trees of MassachusettsA pocket field guide to 83 trees, from the state’s 1925 and 2016 forestry manuals: leaves, bark, where each grows.Trees of Egremont’s forest ›

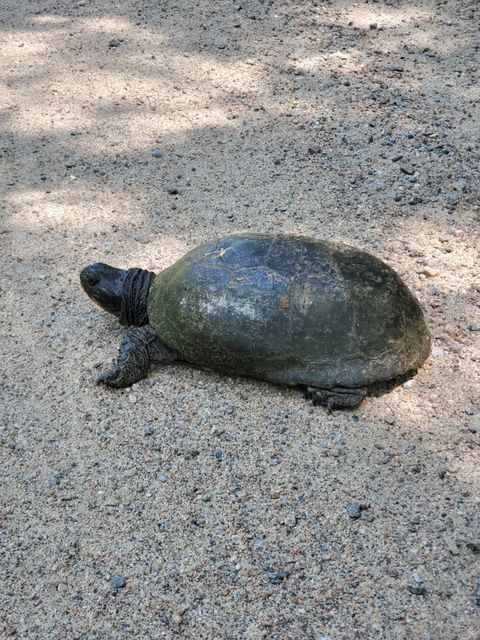

 Rare species of MassachusettsThe 453 plants and animals on the state’s Endangered Species Act list, with photographs, and the cities and towns where the state has recorded each one.42 species recorded in Egremont ›
Sources: BioMap 2022 and NHESP Priority Habitats of Rare Species; MassDEP wetlands and the 2022 Integrated List of Waters (categories 4A, 4C and 5 counted as impaired); MassGIS land use 1971, 1985 and 1999 (one method) and 2005; USGS Annual NLCD land cover, 2001 and 2023 (Collection 1); DCR Massachusetts Forest Explorer, 2021 forest cover by municipality (USGS LCMAP); MassGIS 1830 land use (Harvard Forest digitization of the 1830 town maps); MassGIS protected and recreational open space (all owners, permanent protection) for the protected-land overlay; Harvard Forest data archive HF087 and HF210 for the forest mix. All from MassGIS and DCR feature services and the Harvard Forest archive, 1 November 2026. Method.
Climate
In the Western climate division, average annual temperature was 46.1 °F in 1991–2020, 1.6 °F above 1951–1980.
Then and now
| 1951–1980 | 1991–2020 | Change | Trend per century, 1895–2025 | |
|---|---|---|---|---|
| Average annual temperature | 44.6 °F | 46.1 °F | +1.6 °F | +2.4 °F± 0.3 |
| Winter (December to February) | 22.3 °F | 25.0 °F | +2.7 °F | +3.6 °F± 0.7 |
| Summer (June to August) | 65.4 °F | 66.5 °F | +1.2 °F | +2.0 °F± 0.3 |
| Annual precipitation | 47.1 in | 49.4 in | +2.3 in | +4.3 in± 1.5 |
Source: NOAA National Centers for Environmental Information, Climate at a Glance, climate division 1 (Western; Berkshire County), monthly series 1895–2025, NOAA’s adjusted nClimDiv series. Averages are for 1951–1980 and 1991–2020; the winter of a year uses the December before it. The trend is a least-squares line over 1895–2025 (131 years; winter 130), with its standard error after ±. A division is a group of counties, so every town in it carries the same figures.
ShowHide Nearest weather station: Pittsfield Municipal Airport, 19.3 miles (partial record)
Nearest weather station
No Berkshire County station meets the coverage rule: at least 60 years of record and 80% of days observed in both 1951–1980 and 1991–2020. The figures below are from Pittsfield Municipal Airport and are a partial record, built from the years it observed.
| Station and distance | 1951–1980 | 1991–2020 | |
|---|---|---|---|
| Freeze-free seasondays | Pittsfield Municipal Airport, 19.3 miles(partial record: 63% and 73% of days) | 130 | 153 |
| Snowfallinches a year | Pittsfield Municipal Airport, 19.3 miles(partial record: 62% of days in 1951–1980; snowfall not recorded there after 1967) | 79.1 | — |
| Days with 1 inch or more of precipitationdays a year | Pittsfield Municipal Airport, 19.3 miles(partial record: 63% and 73% of days) | 6.8 | 9.8 |
| Days at 90 °F or abovedays a year | Pittsfield Municipal Airport, 19.3 miles(partial record: 63% and 73% of days) | 2.8 | 2.4 |
Source: NOAA NCEI GHCN-Daily station records, averages for 1951–1980 and 1991–2020, as measured. Each row shows the nearest station within 25 miles (straight line from the town’s center) with at least 60 years of record and 80% of days observed in both periods; a dash means the station’s record does not meet the rule for that period. Precipitation counts rain and melted snow. Freeze-free season is the days between the last spring and first fall low of 32 °F or colder.
Extreme rain days
No precipitation station within 25 miles of Egremont meets the record rule (at least 60 years of record and 80% of days observed in both 1951–1980 and 1991–2020), so extreme rain days are not listed.
Source: NOAA NCEI GHCN-Daily station records; thresholds from NOAA Atlas 14, Volume 10 (Northeast), at each station’s location. NOAA is updating these estimates.
ShowHide Storm records for Berkshire County since 1996: 1,608 records
Storm records
Storm records by type, Berkshire County, 1996–2025
Thunderstorm wind
533
Winter storm and winter weather
350
High and strong wind
169
Flood and flash flood
153
Hail
139
Extreme cold and wind chill
89
Heavy snow
50
Heat
42
Other types
83
All strips use one scale: the tallest bar, thunderstorm wind in 2021, is 45 records.
Counts of storm records, not of storms: one storm can produce several records, and reporting has improved over time.
Reported property and crop damage, 1996–2025: $17.2 million in 2025 dollars. Largest single record since 1950: Tornado, August 28, 1973, $181 million in 2025 dollars.
The records also list three deaths and 20 injuries.
Source: NOAA National Centers for Environmental Information, Storm Events Database, records for the county and its forecast zones, 1996–2025. All event types are recorded from 1996; before then the database holds only tornado, thunderstorm wind and hail, so the largest-record line reaches back to 1950 and its early damage values are order-of-magnitude estimates. NOAA revised its event types in 2007, and some categories begin then. Related types share a strip: flood with flash flood, high wind with strong wind, winter storm with winter weather, coastal flood with storm surge, extreme cold with cold/wind chill, heat with excessive heat. Up to eight types with at least 20 records in the county get a strip; the rest are in Other types. Deaths and injuries are direct plus indirect. Damage is the reporter’s estimate of property and crop damage, a floor and not a full cost, in 2025 dollars by the BLS consumer price index.
ShowHide Rivers, low water, public water sources: nearest active stream gauge 6.1 miles away; low-water record and drought declarations; one public water source located in the town
Rivers and coast
Nearest active stream gauge: Housatonic River near Great Barrington, MA (6.1 miles), draining 282 square miles. Its record annual peak is 12,200 cubic feet per second, in water year 1949, among 111 years of annual peaks (1914–2024). The USGS marks that peak as affected by regulation or diversion to an unknown degree.
Annual peak streamflow at Housatonic River near Great Barrington, MA, water years 1914–2024
Source: U.S. Geological Survey, National Water Information System, annual peak streamflow, gauges with 50 or more water years of peaks and a peak in water year 2015 or later, within 15 miles of the town’s center. A water year runs from October 1 to September 30. A gauge measures one point on a river, not the town.
Low water
Drought declarations: Egremont is in the Western drought region. The state declares drought levels (the Secretary of Energy and Environmental Affairs, on the Drought Management Task Force’s review). Each month in the state’s tables since November 2001 is colored by the level declared; a month with a change partway through is split in two and read as “mid-month”.
State drought declarations for the Western drought region, November 2001 to September 2026
Under the 2013 plan (in use to 2017):AdvisoryWatchWarningUnder the 2019 plan (from 2019):MildSignificantCriticalNo declaration listed
Periods at the highest level of each plan (Warning, Critical):
- Warning: October 2016 to December 2016
- Critical: mid-October 2024 to November 2024, declared November 19, 2024
Source: Massachusetts Executive Office of Energy and Environmental Affairs, History of drought declarations in Massachusetts (2019 to 2026) and the state’s Drought Status History, dated August 12, 2025 (2001 to 2017); press releases for October 2024 and for 2026. Dates are the state’s month labels, not declaration days; a month with no row in the tables has no declaration listed. Level names follow the plan in effect: Advisory, Watch and Warning under the 2013 plan (to 2017); Mild, Significant and Critical under the 2019 plan (from 2019). The two sets are not matched level for level. Drought regions follow the county rule in the state’s Drought Management Plan (Table 2): Western is Berkshire County; CT River Valley is Franklin, Hampshire and Hampden; Central is Worcester; Northeast is Essex, Middlesex and Suffolk, with the town of Brookline; Southeast is Bristol, Plymouth and Norfolk except Brookline; Cape Cod is Barnstable; Islands is Nantucket and Dukes. The state can also declare by county or river basin.
Low flow at Housatonic River near Great Barrington, MA (6.1 miles; drains 282 square miles): the lowest 7-day average flow in the gauge’s record (USGS daily values, 1913–2025) is 44.7 cubic feet per second, in water year 1931 (the window ends October 10, 1930).
Regulated by dams or diversions. USGS flags this gauge as regulated: its flows include reservoir releases, withdrawals, diversions and wastewater returns, and are not natural flows.
Lowest 7-day average flow each water year, Housatonic River near Great Barrington, MA, 1913–2025
The dashed line is the 7Q10, 67.4 cubic feet per second, a USGS statistic for the climatic year (April 1 to March 31) over April 1, 1914 to March 31, 2021; it is not comparable year for year with the water-year values shown.
One bar per water year (October 1 to September 30): the lowest 7-day average flow in the year, for years with at least 330 days of flow data. Shaded years have no value; they are gaps, not zero. The orange bar is the lowest in the record: 44.7 cubic feet per second, water year 1931. The scale starts at zero. Source: U.S. Geological Survey daily mean discharge (parameter 00060), NWIS daily values, gauge 01197500, record through September 30, 2025, retrieved November 8, 2026; 7Q10 from the USGS data release Low-flow statistic equations and supplementary data for Massachusetts (2025). These are records of past flows; they do not predict flows or restrictions and say nothing about cause.
Public water sources in town
Egremont has one active community-system source located in the town: no groundwater and one surface water.
Community water systems with an active source in the town (1):
- Egremont Water Dept
Primary watershed: Hubbard Brook (majority: 100% of the town’s active community-system sources), in the Housatonic river basin. Surface-water intakes can draw from upstream, and wells from an aquifer that extends past the watershed.
Linked gauge: Housatonic River near Ashley Falls, MA, 4.7 miles from the center of that watershed: the nearest active gauge in the same larger (HUC8) watershed, not a gauge on a town source. Whether the flow at this gauge is regulated is not known.
Source: MassGIS Public Water Supplies (MassDEP), as of September 3, 2025, each source placed in the town where it is located (the layer locates sources, not service areas; a system’s wells can be in another town); watersheds from the USGS Watershed Boundary Dataset; gauges from the USGS NWIS site catalog, retrieved November 8, 2026. Labels on system names are the data’s own.
ShowHide What the state projects: +11.7 days a year above 90 °F by 2050 in the Housatonic basin (RCP4.5, median)
What the state projects
Days a year, Housatonic basin: baseline and the Commonwealth’s projections for 2050 and 2070
RCP4.5RCP8.5Dot: median. Bar: 10th to 90th percentile.
| Baseline, days a year | 2050, RCP4.5 | 2050, RCP8.5 | 2070, RCP4.5 | 2070, RCP8.5 | |
|---|---|---|---|---|---|
| Days above 90 °F | 2.5 | +11.7+5.8 to +20.4 | +20.4+8.3 to +33.2 | +15.3+8.3 to +26.2 | +33.2+15.3 to +55.0 |
| Days above 1 inch of precipitation (heavy-precipitation days) | 4.0 | +1.0+0.6 to +1.4 | +1.4+0.8 to +1.8 | +1.2+0.8 to +1.6 | +1.8+1.2 to +2.3 |
Source: Massachusetts Executive Office of Energy and Environmental Affairs, Climate and Hydrologic Risk Project, Phase 1 (Cornell University stochastic weather generator), HUC8 basin projections for the Housatonic basin (USGS unit 01100005), which holds 98% of Egremont’s land. These are the Commonwealth’s projections. Scenarios: RCP4.5 and RCP8.5, two emissions pathways. Each figure is the median change across a 50-member ensemble, with the 10th to 90th percentile range beneath it. Baseline: the ensemble median of simulations fit to observations, 1950–2013. Each value is a 30-year average centered on the year shown.
ShowHide Public assets in mapped hazard areas, dam condition and older flood maps: no FEMA digital flood map; of two High or Significant hazard dams, none are rated Poor or Unsatisfactory
Public assets in mapped hazard areas
FEMA has no effective digital flood map for Egremont in the state’s data, so road miles and public facilities in the 1% flood zone cannot be counted here. This is a gap in the maps, not a finding about the town.
Older flood maps
Older FEMA flood maps (Q3, digitized from paper maps of the 1980s-90s): 1.8 miles of public road in the 1% zone and 0.1 miles in the 0.2% zone (1.9 and 0.1 miles counting all roads); no named public facilities (not counting water-supply sources) in the 1% zone.
Source: MassGIS “FEMA Q3 Flood Zones from Paper FIRMs” (metadata July 1997), digitized by FEMA from paper maps and fitted to USGS 1:24,000 quadrangles; the edges of maps are not matched, and MassGIS says the layer is not suitable for parcel-level or engineering use. Road Inventory segments clipped to the zones (public roads are segments with a recorded jurisdiction) and public facilities placed by point, as for the current-map figures. These figures are not comparable with the current-map figures town by town.
Scour-critical bridges: none coded 0 to 3 on the federal inventory’s scour item.
Stream crossings with no aquatic organism passage: 11 of 31 assessed road-stream crossings (all road owners) in Egremont; 32 are mapped. Assessment is partial and volunteer-driven.
Dams rated by the state
Of two High or Significant hazard dams, none are rated Poor or Unsatisfactory in the state’s condition assessments reported to the National Inventory of Dams. Assessments are dated September 14, 2022 to June 19, 2025.
| Dam | Owner | Hazard potential | Condition | Assessed |
|---|---|---|---|---|
| Mill Pond DamKarner Brook | State owned | Significant | Satisfactory | September 14, 2022 |
| Prospect Lake DamProspect Brook | Privately owned | Significant | Satisfactory | June 19, 2025 |
A condition rating is not a prediction of failure or an engineering opinion. Hazard potential describes the consequences if a dam failed, not how likely that is. Low-hazard dams and dams with no rating are outside this count.
Source: MassGIS Dams (DCR Office of Dam Safety), retrieved November 8, 2026, for hazard potential and owner type (the owner class only; owners are not named); condition ratings and assessment dates from the U.S. Army Corps of Engineers National Inventory of Dams, Massachusetts, downloaded November 8, 2026. Poor and Unsatisfactory are the state’s terms as reported to the Inventory. Dam names are as recorded by the state.
Source: roads: MassDOT Road Inventory (pulled November 8, 2026) clipped to the FEMA National Flood Hazard Layer zones A, AE, AH, AO and VE as served by MassGIS (October 18, 2026), each community’s effective map, many of which predate current conditions; facilities: MassGIS schools, police and fire stations (2022), town halls (2017), libraries (2025), DPH hospitals (March 2026), EPA wastewater plants, and MassDEP public water supplies (September 2025), each a mapped point; bridges: FHWA National Bridge Inventory 2025, scour item; crossings: NAACC download of April 8, 2026. Counts are of mapped locations inside a mapped zone; they do not describe damage or failure.
ShowHide Snow and ice spending, FY2012–FY2026: spent more than appropriated in 11 of 14 years
Snow and ice
Egremont spent more than it appropriated for snow and ice in 11 of the 14 fiscal years with a report, FY2012–FY2026; the largest overrun was $70,967, in FY2018.
Snow and ice spending, snowfall and winter storm records, Egremont, FY2012–FY2025
AppropriatedSpentNumber of storm records
| Fiscal year | Appropriated | Spent | Spent minus appropriated |
|---|---|---|---|
| FY2012 | $94,564 | $89,122 | −$5,442 |
| FY2013 | $95,000 | $95,773 | +$773 |
| FY2014 | $95,000 | $115,413 | +$20,413 |
| FY2015 | $95,000 | $146,061 | +$51,061 |
| FY2016 | $95,000 | $56,161 | −$38,839 |
| FY2017 | $95,000 | $160,840 | +$65,840 |
| FY2018 | $95,000 | $165,967 | +$70,967 |
| FY2019 | $95,000 | $129,940 | +$34,940 |
| FY2020 | $95,000 | $106,049 | +$11,049 |
| FY2021 | $95,000 | $88,084 | −$6,916 |
| FY2022 | $95,000 | $127,182 | +$32,182 |
| FY2023 | $95,000 | $114,562 | +$19,562 |
| FY2024 | $95,000 | $96,528 | +$1,528 |
| FY2025 | $95,000 | $119,294 | +$24,294 |
| FY2026 | — | — | — |
No snowfall column: no station within 25 miles of Egremont has a snowfall record that meets the coverage rule.
Source: Massachusetts Department of Revenue, Division of Local Services, Municipal Databank, Snow and Ice Data Sheets (submitted by the town, unaudited), FY2012–FY2026. Appropriated is the original budget plus supplemental appropriations and transfers; spent is expenditures and encumbrances charged to the appropriation. FY2026 reports were still arriving when the data were pulled.
ShowHide Fire: 2 fires and 0.5 acres recorded in Egremont, 2015–2024
Wildfires recorded in Egremont, 2015–2024
Egremont had two recorded fires, burning 0.5 acres, in 2015–2024 in the federal Fire Occurrence Database.
| Year | Fires | Acres |
|---|---|---|
| 2015 | 1 | 0.25 |
| 2016 | 0 | 0 |
| 2017 | 0 | 0 |
| 2018 | 0 | 0 |
| 2019 | 0 | 0 |
| 2020 | 0 | 0 |
| 2021 | 0 | 0 |
| 2022 | 0 | 0 |
| 2023 | 0 | 0 |
| 2024 | 1 | 0.25 |
| 2015–2024 | 2 | 0.5 |
Wildfires recorded in Berkshire County, 2015–2024
Fires
411 fires
Acres burned
3,312.59 acres
Fires and acres recorded in Berkshire County by year, 2015–2024; each strip has its own scale. Counts are of recorded fires, including very small ones.
Source: U.S. Forest Service Research Data Archive, Fire Program Analysis Fire-Occurrence Database (FPA FOD), 7th edition, 1992–2024 (doi 10.2737/RDS-2013-0009.7), records for Massachusetts, 2015–2024 only. For 2015–2024 the records come from the statewide state reporting system (the database’s coverage note: statewide_state_system); earlier records are partial and are not shown here. Town is from each record’s location; county is the county containing it. Fires on military training ranges (Devens; Camp Edwards) are labeled in the data and left out of the totals. The database holds no cause detail shown here; a large share of its records have no specific cause. The 2025 and 2026 seasons are not in this edition.
ShowHide Disasters and aid: 27 federal declarations designated Berkshire County since 1953; hazard mitigation plan status, aid to the town, county power outages and the Commonwealth’s recent requests
Federal disaster declarations and aid
Since 1953, 27 federal declarations have designated Berkshire County, counting statewide declarations.
Federal declarations designating Berkshire County, 1953–2026
Major disasters (DR)
14
Emergencies and fire management (EM, FM)
13
A declaration is counted in the year it was made if it designated the county or the whole state, for any program (public assistance, individual assistance or hazard mitigation). Declarations made only for a tribe are not counted. Each strip has its own scale.
Source: FEMA, OpenFEMA Disaster Declarations Summaries (API), retrieved November 8, 2026.
Aid to the Egremont government
Public Assistance: FEMA has obligated $101,246 in federal share to the Egremont town government, across 16 funded projects in 10 disasters (declarations from December 1999 on). These are obligations to date, not spending. Fire districts, light plants, schools and other local units are separate and not counted.
Hazard mitigation grants: no subapplication from the Egremont town government appears in the data.
Source: FEMA, OpenFEMA Public Assistance Funded Project Details (refreshed July 23, 2026; applicants refreshed November 8, 2026) and Hazard Mitigation Assistance Subapplications. Applicants are matched to the town government by name, so a name in an unusual form can be missed. “Obligated” means FEMA has committed the money; it does not mean the work is built or complete.
National Flood Insurance Program: since 1978, 8 claim records for Egremont, 6 of them with a payment, $34,052 paid in all (2 records and $19,740 paid since 2010). Policies in force on December 31, 2025: 13.
Source: FEMA, OpenFEMA NFIP Claims and Policies (as of September 8, 2026). Claims paid are building, contents and increased cost of compliance payments, 1978 to date; they are not a measure of damage. Multi-year totals only: a single year in a small town can identify one claim, and dollar totals are shown only where three or more claims were paid.
Hazard mitigation plan: Approved, expires February 22, 2028 (FEMA). Plan: Town of Egremont 2022 Municipal Vulnerability Preparedness (MVP) - Hazard Mitigation Plan (HMP), approved February 23, 2023.
Source: FEMA, OpenFEMA Hazard Mitigation Plan Statuses (API), retrieved November 8, 2026. The best entry for the town is shown.
Power outages, Berkshire County, 2021–2025
| Year | Outage hours per housing unit | Customer-outage hours | Largest event (Eastern date) |
|---|---|---|---|
| 2021 | 2.3 | 160,523 | May 27, 20217,115 customers out at the peak |
| 2022 | 3.0 | 209,785 | December 23, 20224,427 customers out at the peak |
| 2023 | 7.4 | 517,347 | March 14, 202325,030 customers out at the peak |
| 2024 | 4.0 | 277,567 | July 16, 20247,671 customers out at the peak |
| 2025 | 4.1 | 289,274 | September 6, 202510,881 customers out at the peak |
Source: DOE-supported EAGLE-I, Oak Ridge National Laboratory, readings every 15 minutes (figshare, version 4; 2025 added February 24, 2026). Customer-outage hours are customers without power times hours; per housing unit divides by the county’s housing units (ACS 2020–2024, seasonal and vacant units included). Counts are customers (utility meters) without power, not people. One customer can be a household, a business or a seasonal home. The largest event is the run of readings with at least 5% of the county’s housing units without power that peaked highest. EAGLE-I collects utility outage maps; coverage was 98–99% of Massachusetts customers in 2021–22 and is not documented for 2023–2025. In some years one event accounts for most of the hours. 2025 is a lower bound (20,798 blank readings). Times are Eastern, converted from UTC.
Recent requests by the Commonwealth
In December 2023 the Commonwealth requested a major disaster declaration for the September 2023 storms and flooding in Worcester, Hampden and Bristol counties (Leominster and surrounding communities). FEMA denied the request in a letter dated February 11, 2024 (as reported by CBS Boston; the letter was not retrieved); the Commonwealth appealed on March 11, 2024; FEMA’s letter of May 28, 2024 states that the appeal was approved on May 15 for individual assistance in Bristol and Worcester counties and for hazard mitigation statewide, and that the Public Assistance appeal was denied (DR-4780).
For the February 2026 blizzard the Commonwealth requested a major disaster declaration on April 7, 2026, reporting about $45 million in eligible costs (the Commonwealth’s figure; no FEMA document with that figure was seen). The request was denied on July 2, 2026; the Commonwealth appealed on July 31; the appeal was denied on September 2, 2026 (FEMA record). The Mashpee Wampanoag Tribe’s separate request for the same storm was approved on June 30, 2026 (DR-4919).
Sources: OpenFEMA Disaster Declarations Summaries and Declaration Denials (request 26052; status date September 2, 2026); FEMA letter of May 28, 2024; Commonwealth releases of March 12, 2024 and July 31, 2026; the Governor’s letter of July 31, 2026 (the $45 million, reported there with a $13.6 million threshold); CBS Boston, February 13, 2024 (date of the February 11 letter, which was not retrieved).
Station records are as measured, not adjusted for station moves or instrument changes; the regional series are NOAA’s adjusted series. Projections are the sources’ own, shown with their scenarios and years.