Commonwealth · Findings
Massachusetts in 16 charts
Sixteen charts from the Commonwealth study: the state budget, how the Legislature decides, what cities and towns receive, and schools and roads. Each chart states its finding in a sentence and links to the full account and its sources.
The state budget
Chart 1 of 16
How big the budget is
The enacted budget grew from $38.7B in FY2017 to $62.6B in FY2027; supplemental budgets added up to $9.0B in a year.
FY17
$38.7B
FY18
$39.6B
FY19
$41.3B
FY20
$42.9B
FY21
$45.7B
FY22
$47.6B
FY23
$51.7B
FY24
$55.3B
FY25
$57.0B
FY26
$60.2B
FY27
$62.6B
Source: CTHRU budget to actual (Office of the Comptroller), FY2017–FY2027; FY2027 surtax shares from Section 2F of the budget.
Chart 2 of 16
Where the last two increases went
The budget grew $3.2B (5.6%) in FY2026 and $2.4B (4.0%) in FY2027; health and human services and education took most of both.
Health and human services
Education (with its surtax lines)
Administration and finance
Courts
Public safety
Sheriffs
Housing
Transportation
Secretary of State
Treasurer
Executive Office Of Technology Services And Security
Ctr/Fad Accounting Entities
Source: CTHRU budget to actual (Office of the Comptroller), FY2017–FY2027; FY2027 surtax shares from Section 2F of the budget. Areas that moved $20 million or more in either year; surtax lines are counted with the program they pay for.
Chart 3 of 16
The surtax and the General Fund
Since FY2024 the surtax has paid a growing share of programs the General Fund had paid for: in FY2027, $375 million of child-care grants and $585 million of Chapter 70.
Child care grants to providers (C3)
FY23
$318M
FY24
$475M
FY25
$475M
FY26
$475M
FY27
$475M
Chapter 70 school aid
FY23
$6.0B
FY24
$6.6B
FY25
$6.9B
FY26
$7.4B
FY27
$7.7B
Child care financial assistance
FY23
$694M
FY24
$808M
FY25
$978M
FY26
$1.0B
FY27
$1.2B
Universal school meals
FY23
$180M
FY24
$185M
FY25
$187M
FY26
$184M
FY27
$184M
Special education circuit breaker
FY23
$441M
FY24
$499M
FY25
$741M
FY26
$637M
FY27
$655M
Regional school transportation
FY23
$82M
FY24
$97M
FY25
$108M
FY26
$104M
FY27
$116M
Source: CTHRU budget to actual (Office of the Comptroller), FY2017–FY2027; FY2027 surtax shares from Section 2F of the budget. Enacted plus supplemental appropriations. Point to a column for its figures.
How the Legislature decides
Chart 4 of 16
Size of the request
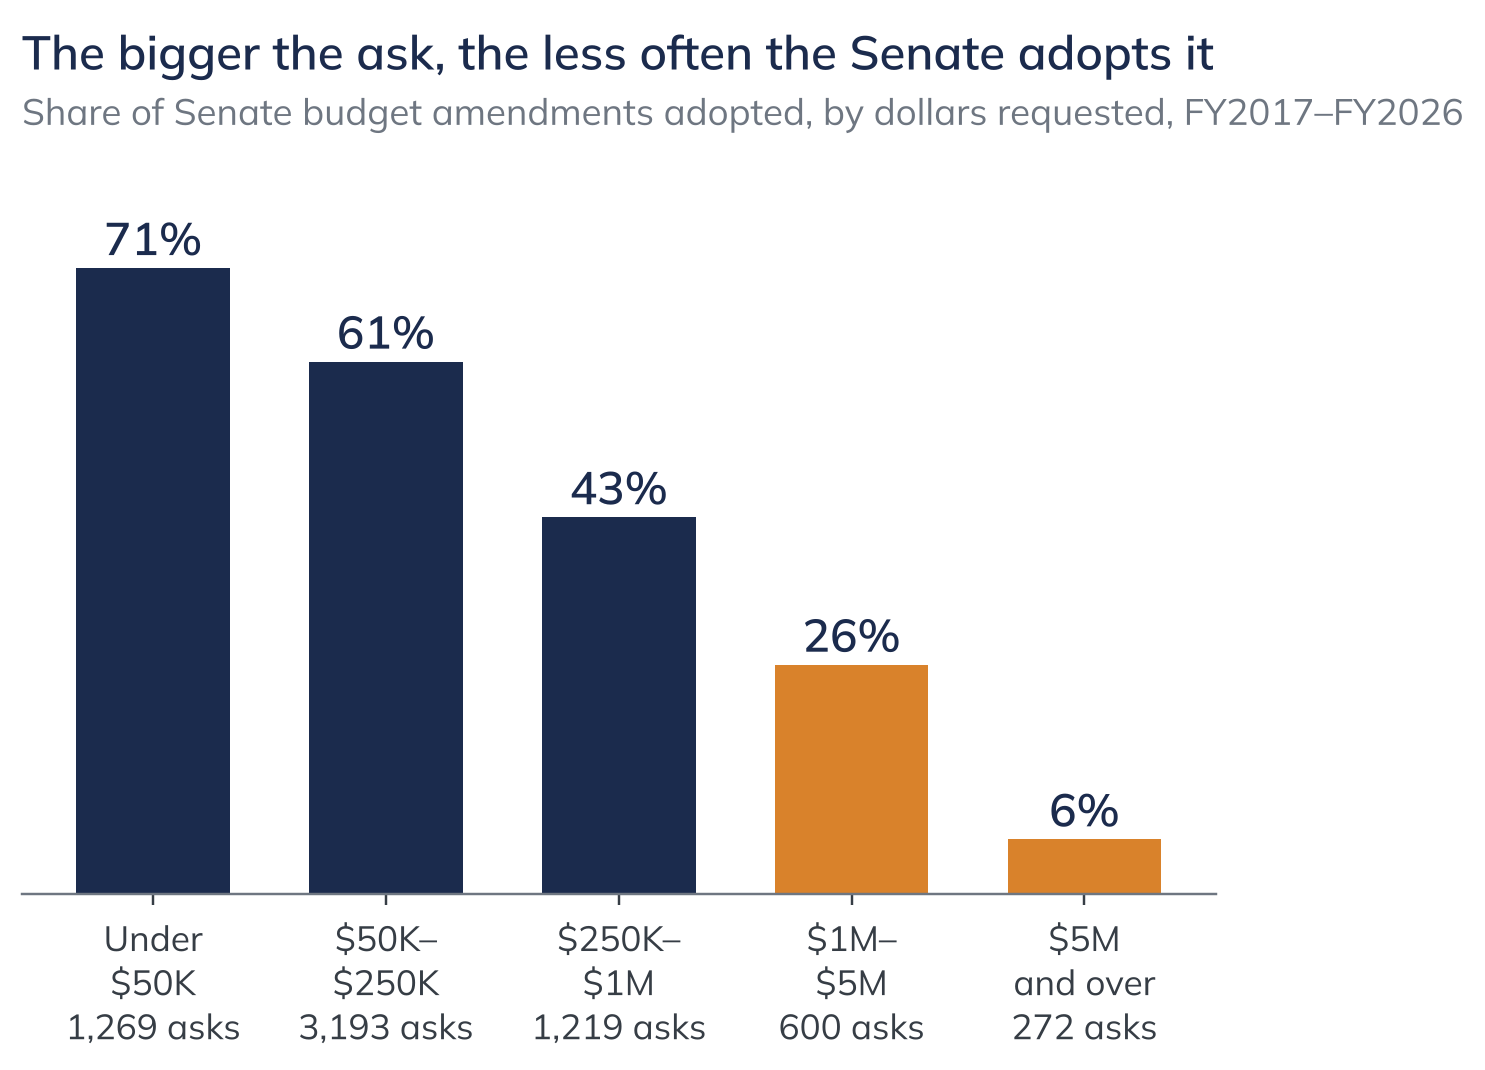
Chart 5 of 16
Posts and the $1–5 million requests
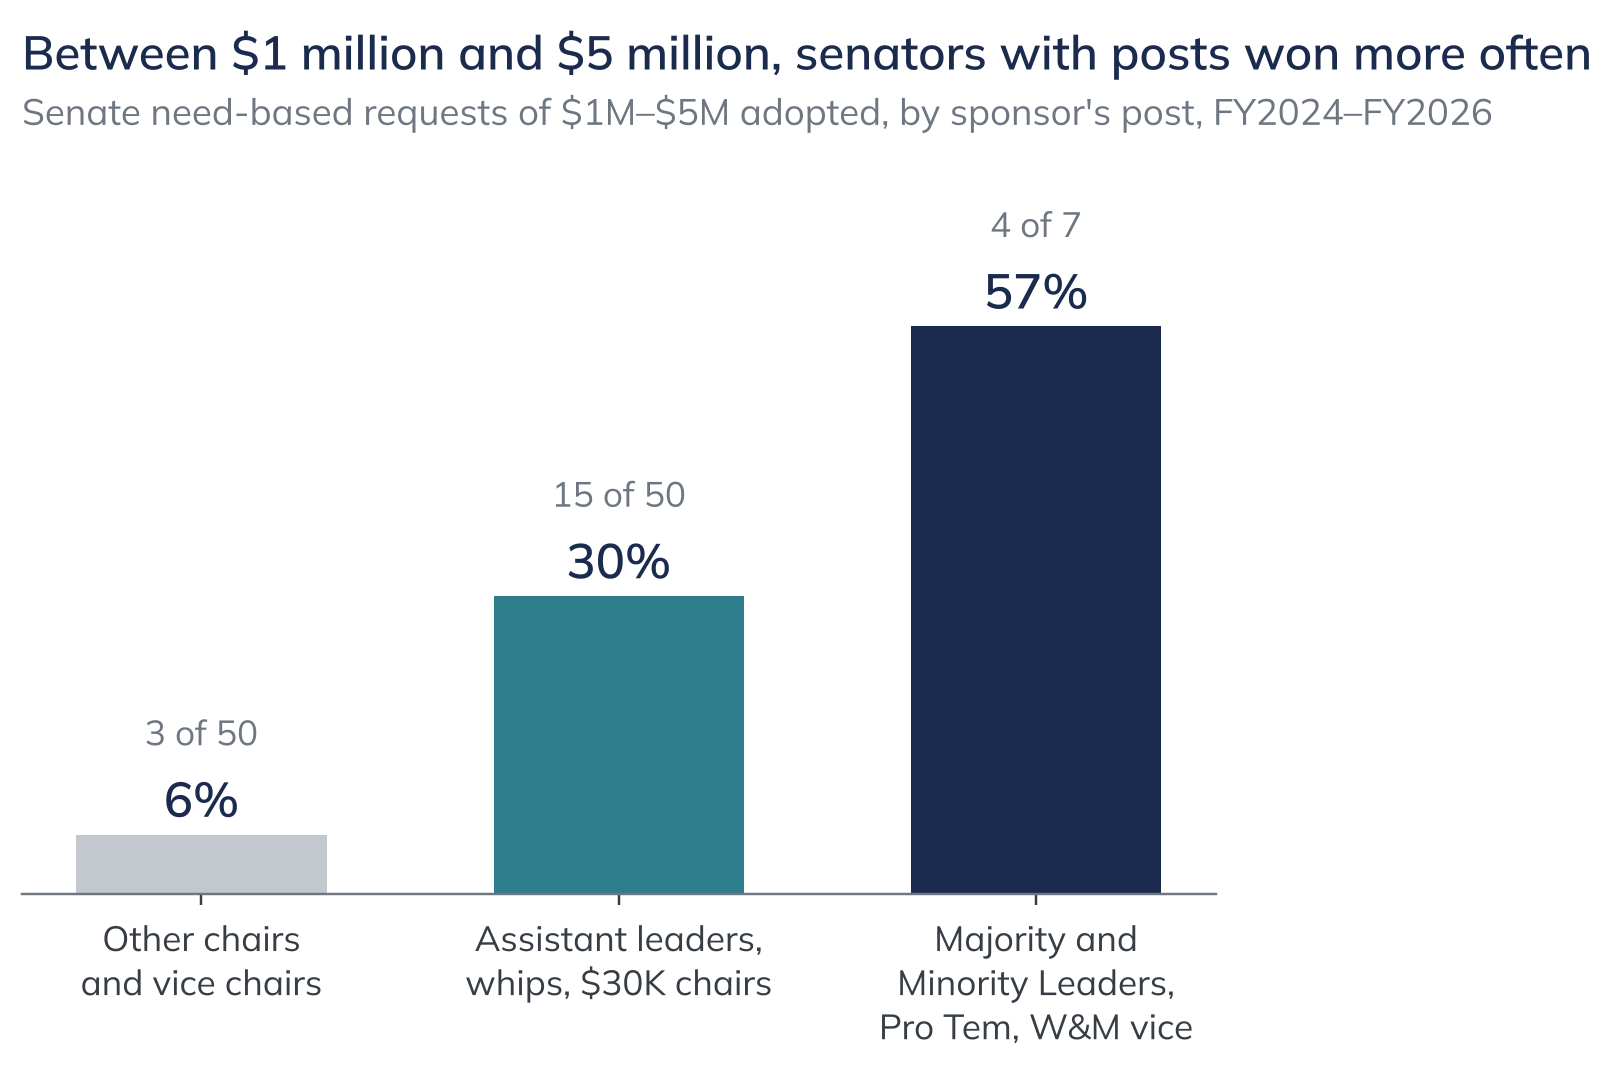
Chart 6 of 16
Across all 351 towns: what explains the money
This chart asks how well each set of factors predicts the ten-year earmark and grant totals of every city and town. Towns differ most by size, so population, roads, jobs and need do most of the work; leadership posts, stipends, campaign giving and connections add less than one point to the prediction.
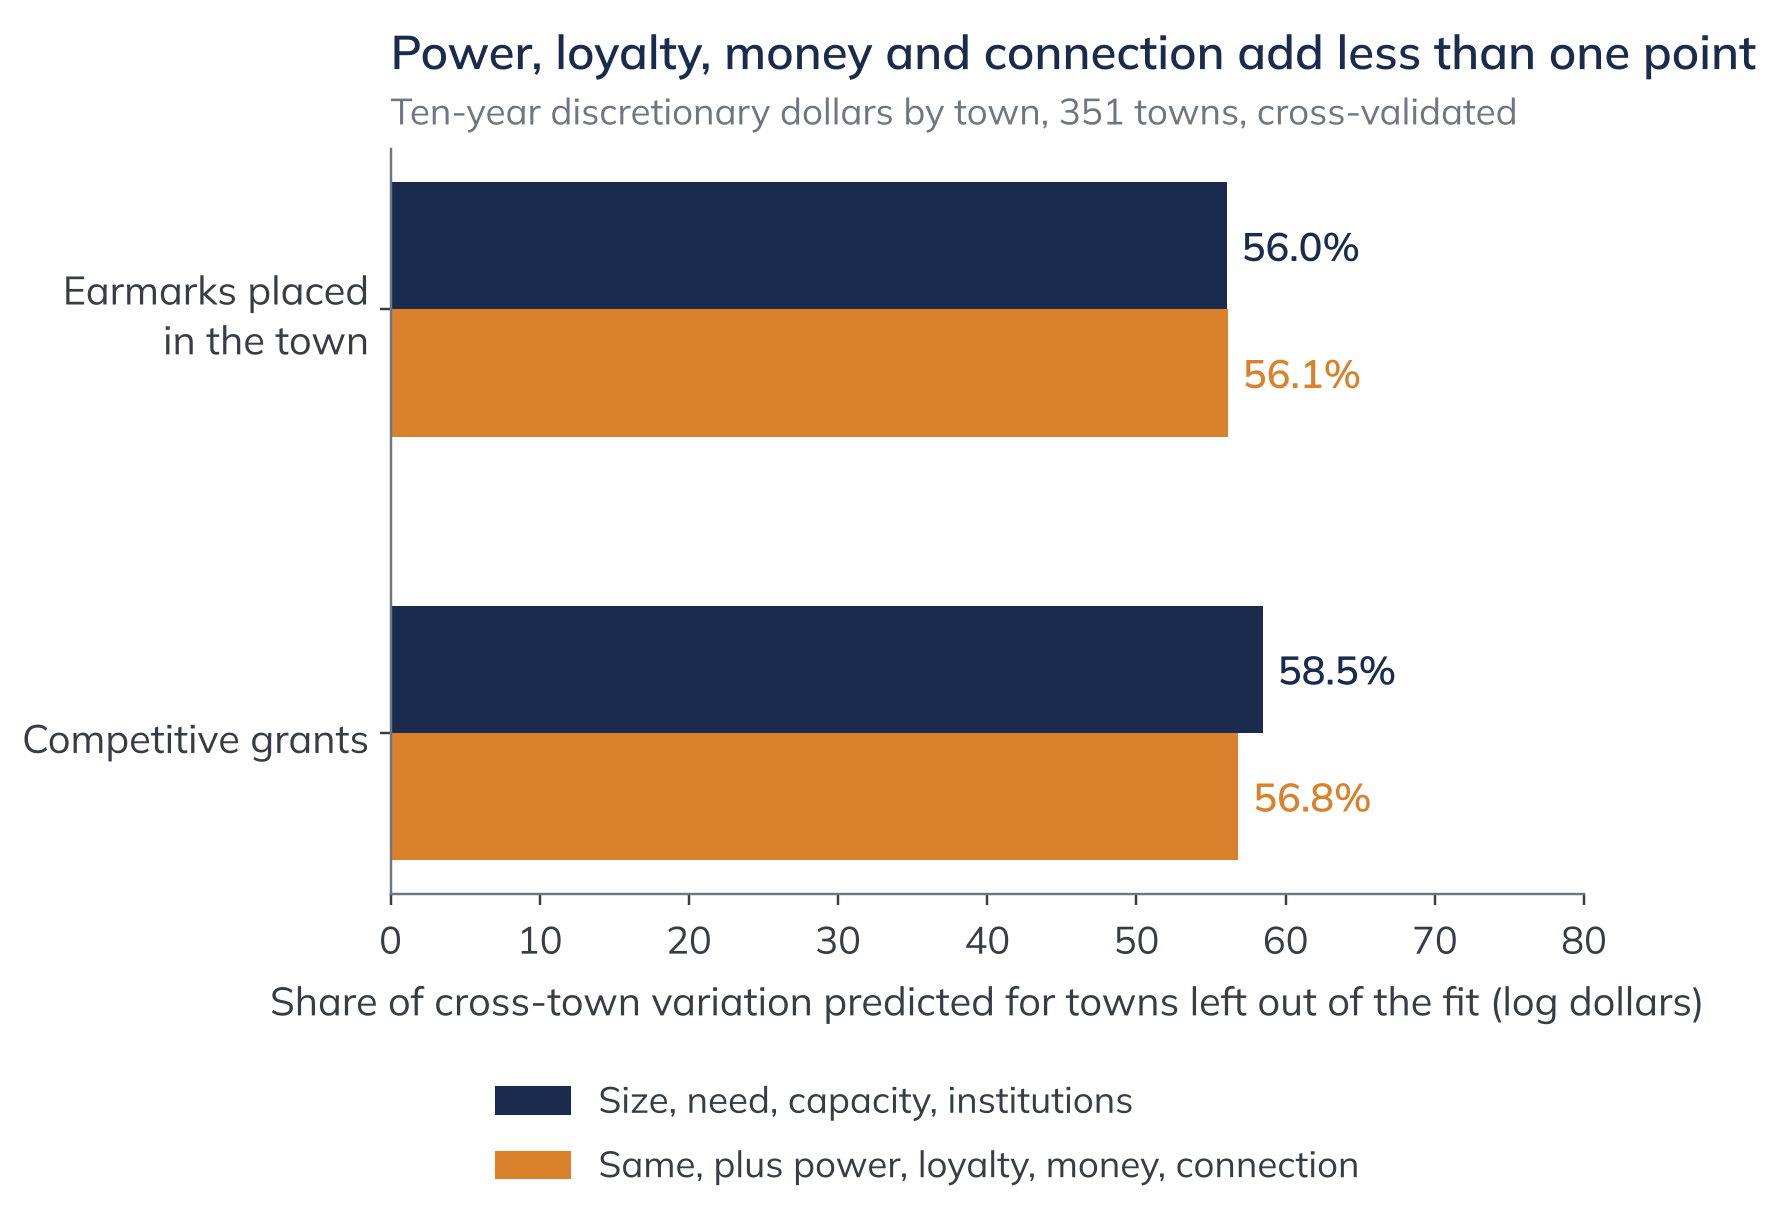
Chart 7 of 16
Inside the House: posts and district money
This chart compares House districts with one another. Holding district population, seniority, election margin and the session constant, earmarks to a district’s cities and towns run 7.2% higher per resident for each $10,000 of the member’s stipend. The difference is real but small next to the differences that size makes between towns, which is why it barely moves the prediction in chart 6.
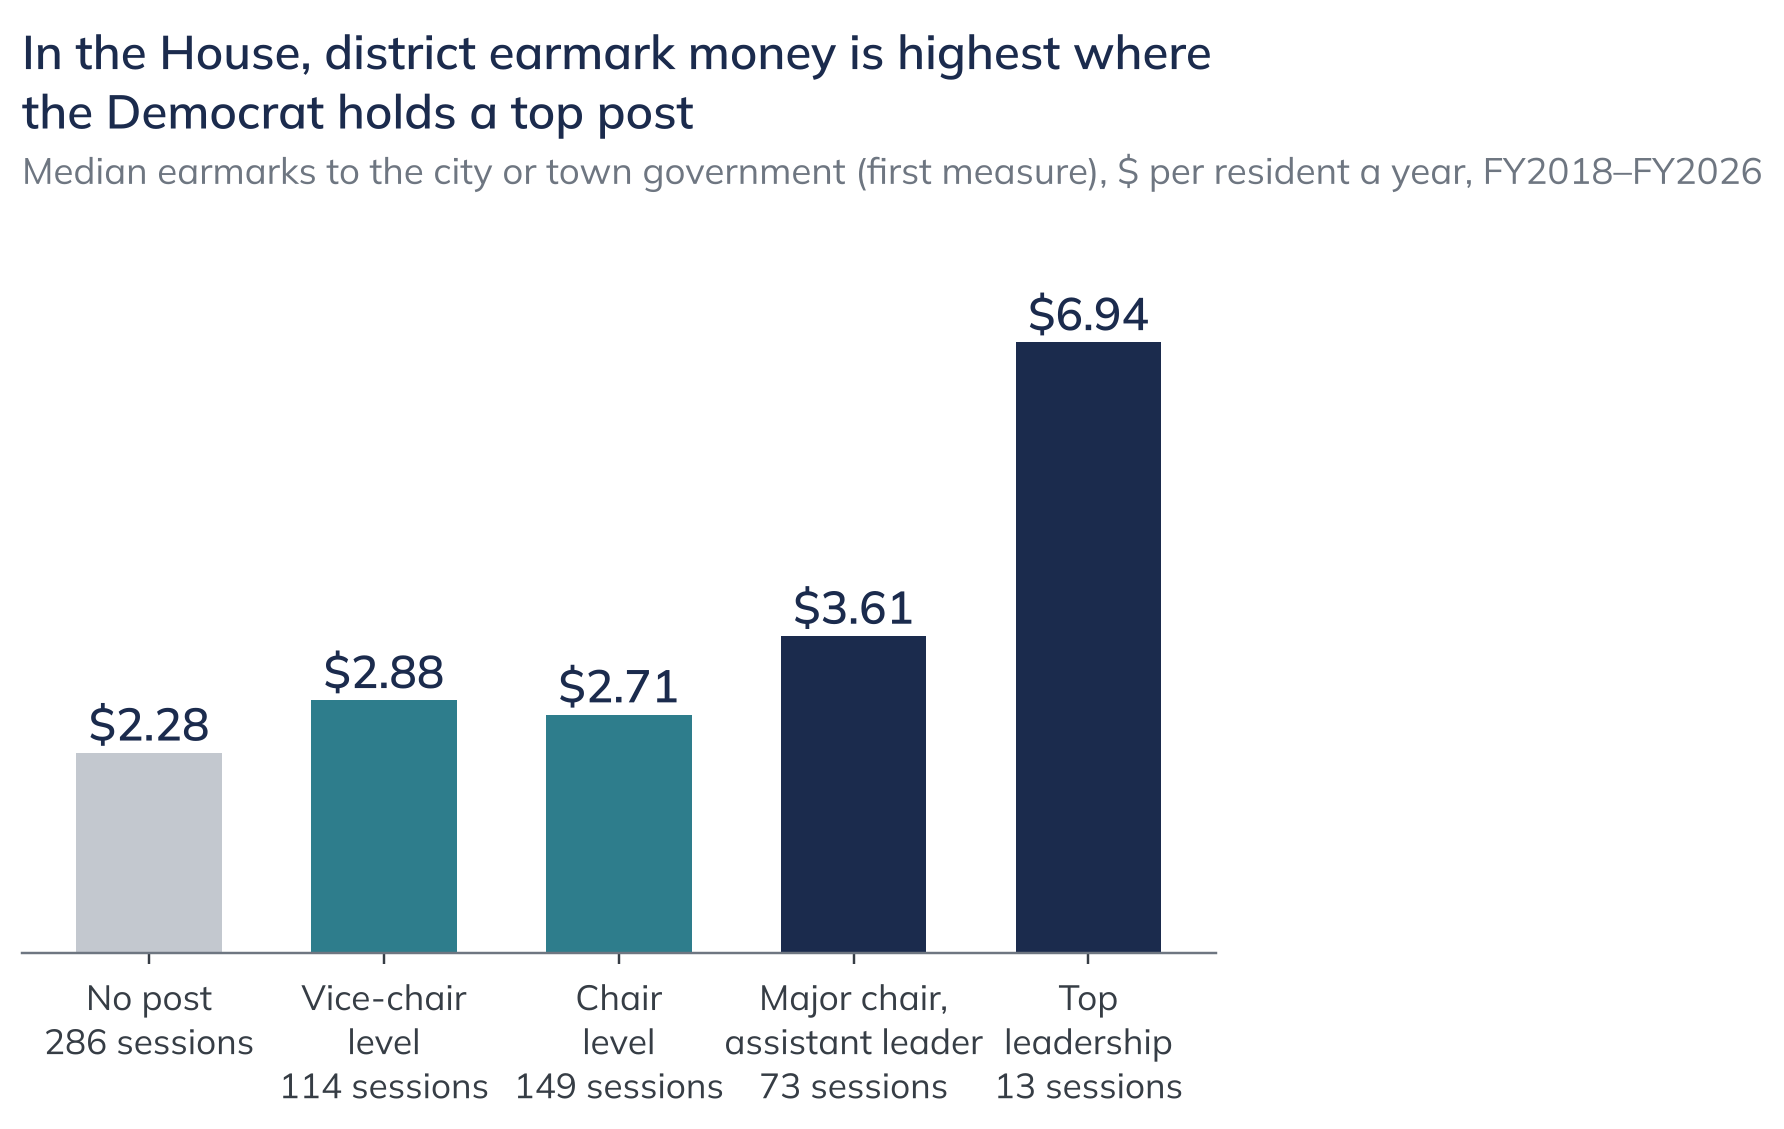
Chart 8 of 16
Reform votes and promotion
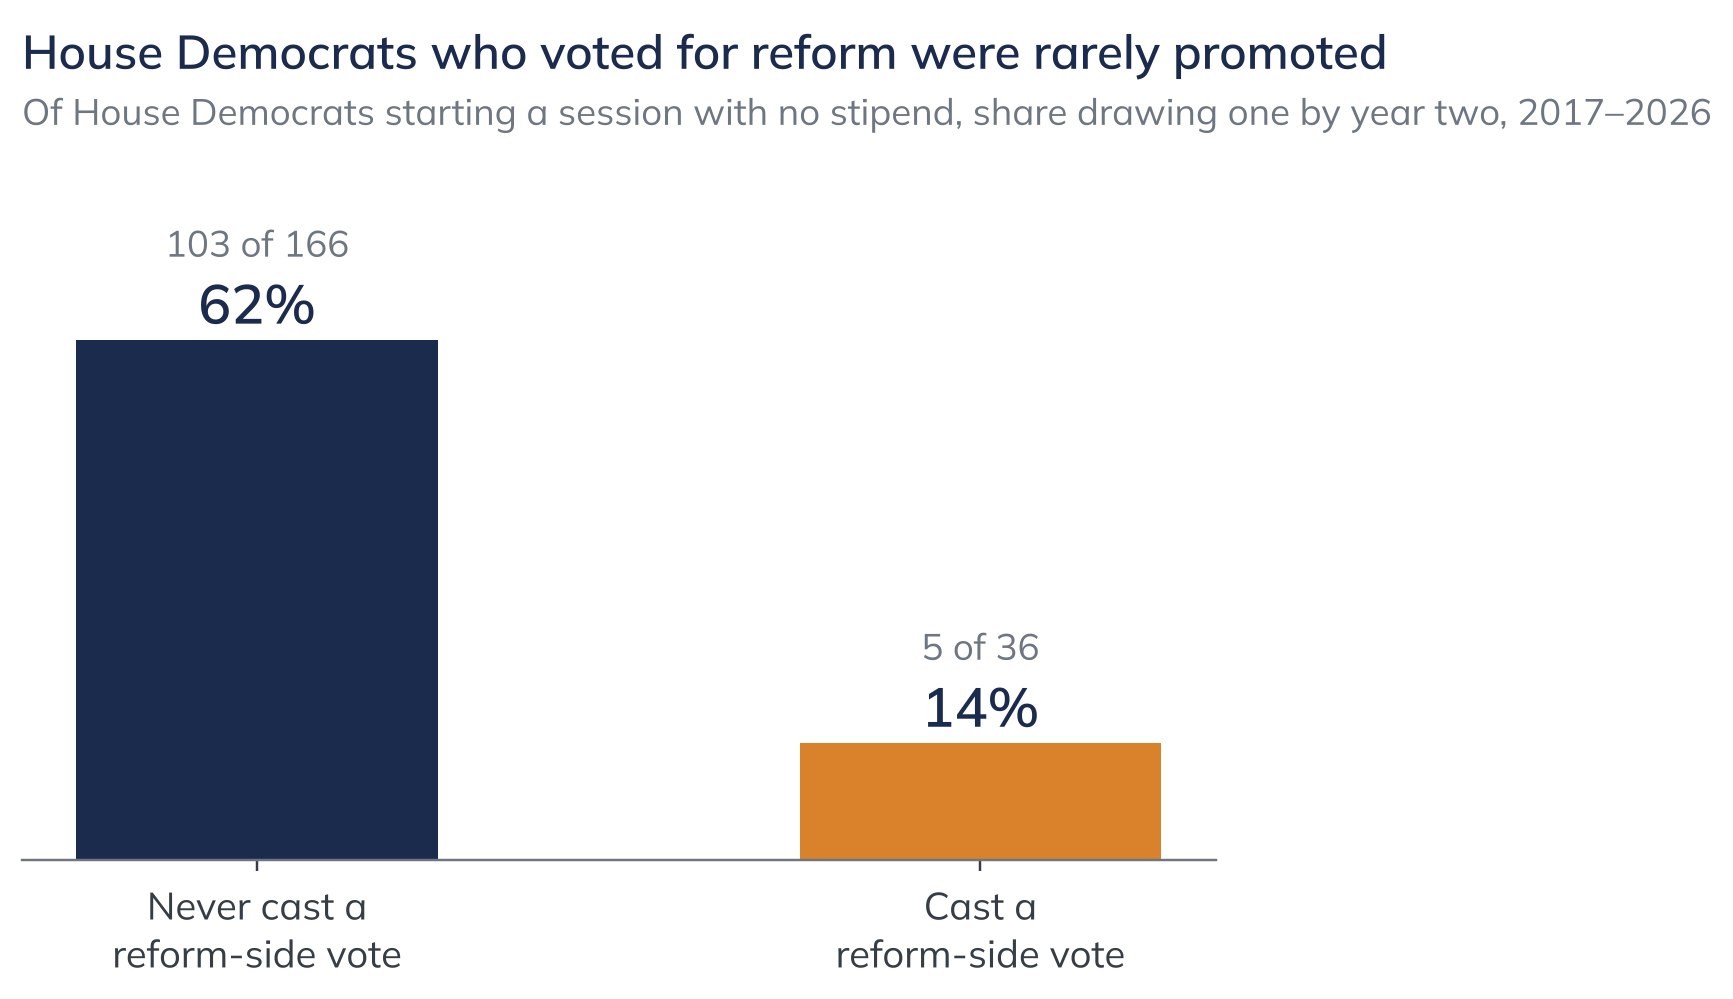
Chart 9 of 16
Campaign money in the House
Top leadershipOther leadership or committee chairVice chair or other postNo post
Contributions this cycle, 2025–26 to date
The five members of top leadership raised a median of $228,000 this cycle, 5.3 times the median for the other 154 members, $43,000.
Every contribution to the member’s own committee filed with the Office of Campaign and Political Finance, including small gifts reported only as a total. 159 of 159 members.
Source: Office of Campaign and Political Finance (ocpf.us), reports filed by October 21, 2026; posts from the Legislature’s records (malegislature.gov). Point to a dot for the member; click it for the member’s page.
Chart 10 of 16
Campaign money in the Senate
Top leadershipOther leadership or committee chair
Contributions this cycle, 2025–26 to date
The six members of top leadership raised a median of $265,000 this cycle, 3.0 times the median for the other 34 members, $88,000.
Every contribution to the member’s own committee filed with the Office of Campaign and Political Finance, including small gifts reported only as a total. 40 of 40 members.
Source: Office of Campaign and Political Finance (ocpf.us), reports filed by October 21, 2026; posts from the Legislature’s records (malegislature.gov). Point to a dot for the member; click it for the member’s page.
What cities and towns receive
Chart 11 of 16
Fairness across 351 municipalities
229 of 351 towns score below 50 on all state aid; the neediest cities score well above.
One circle per town; area shows population. Point to a circle for the town; click it for the town’s page.
Blended Fairness Index score, all state aid, FY2017–FY2026
Below 45 under every weightingDepends on weighting45–55 under every weightingAbove 55 under every weighting
Source: Massanomics analysis of DESE Chapter 70 and circuit-breaker data (doe.mass.edu), DLS cherry sheets (dls-gw.dor.state.ma.us), CTHRU statewide spending (cthru.data.socrata.com) and General Appropriations Acts FY2017–FY2026 (malegislature.gov); population from U.S. Census Bureau ACS 2020–2024. Method in this section and in Methods.
Chart 12 of 16
Per resident or per mile
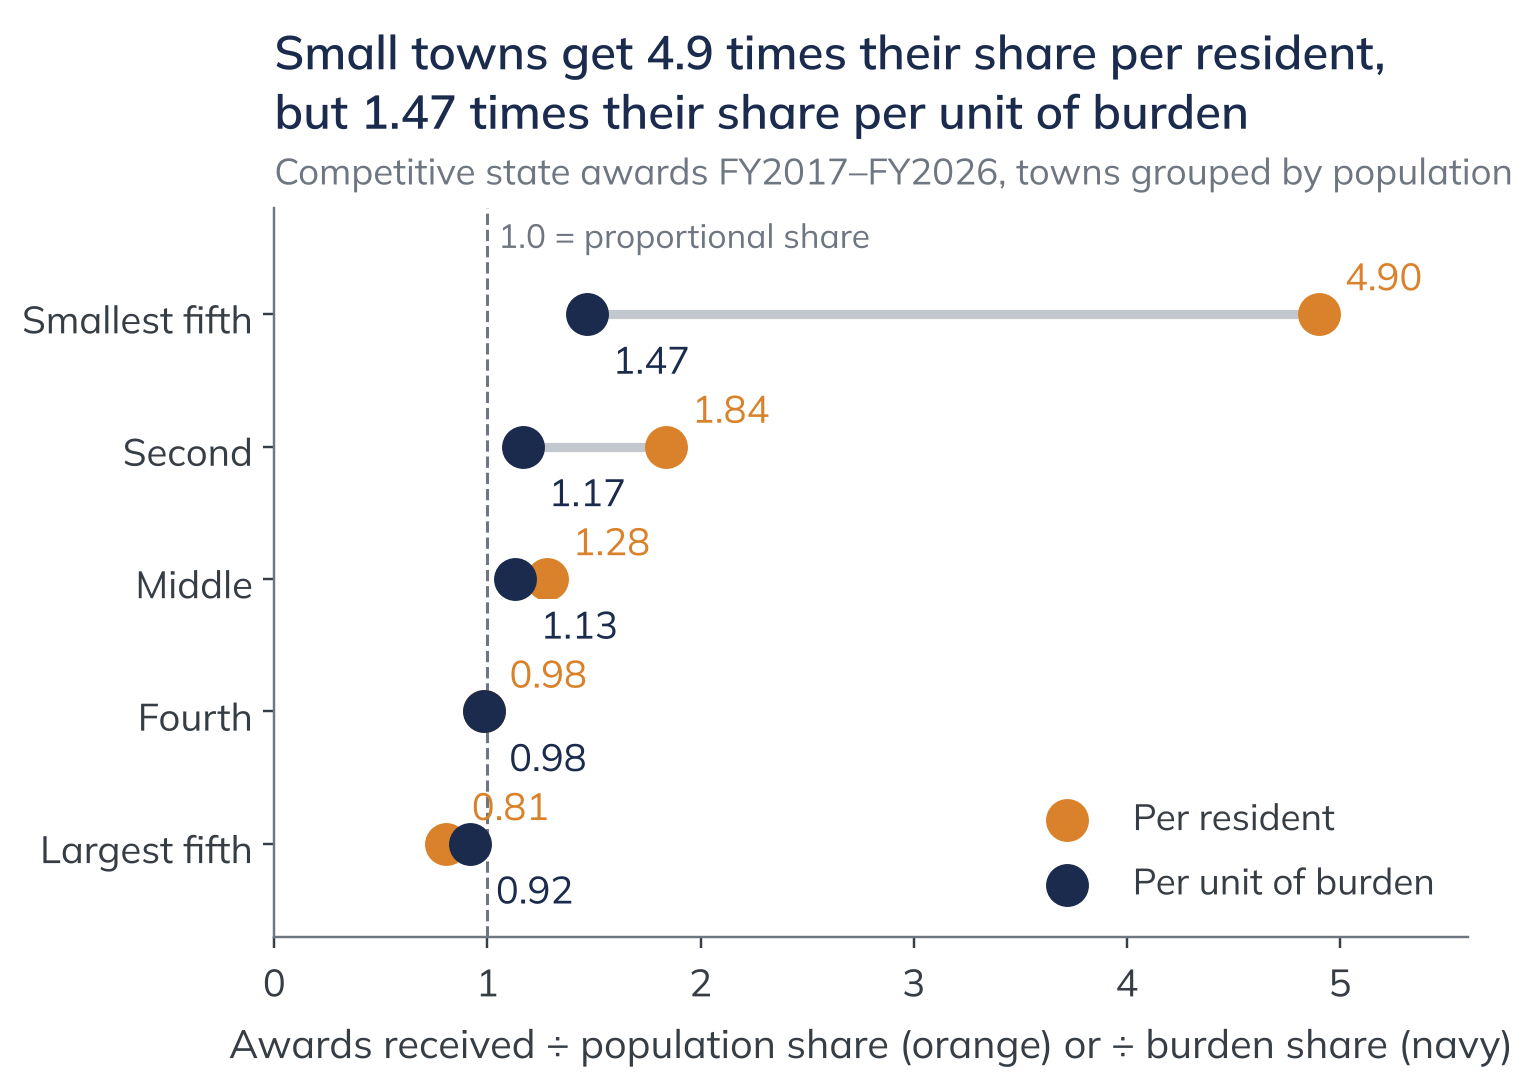
Chart 13 of 16
Aid against inflation
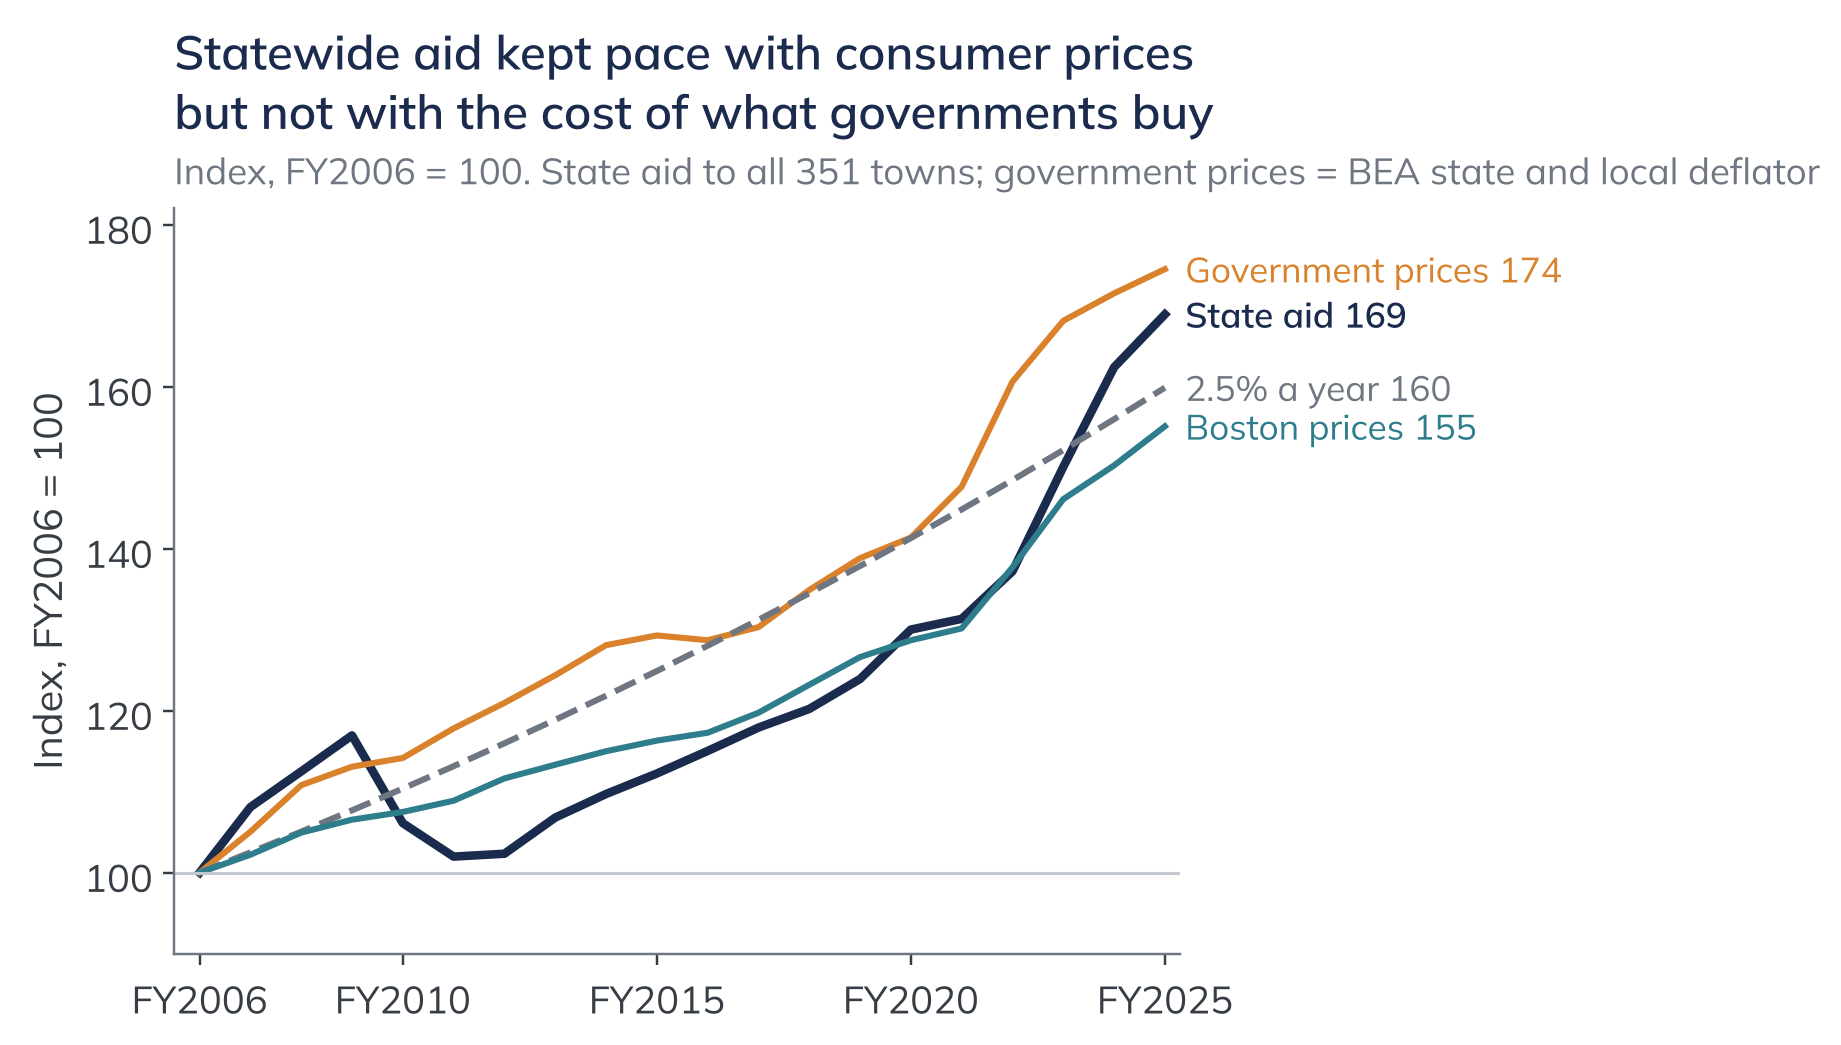
Chart 14 of 16
Aid as a share of town spending
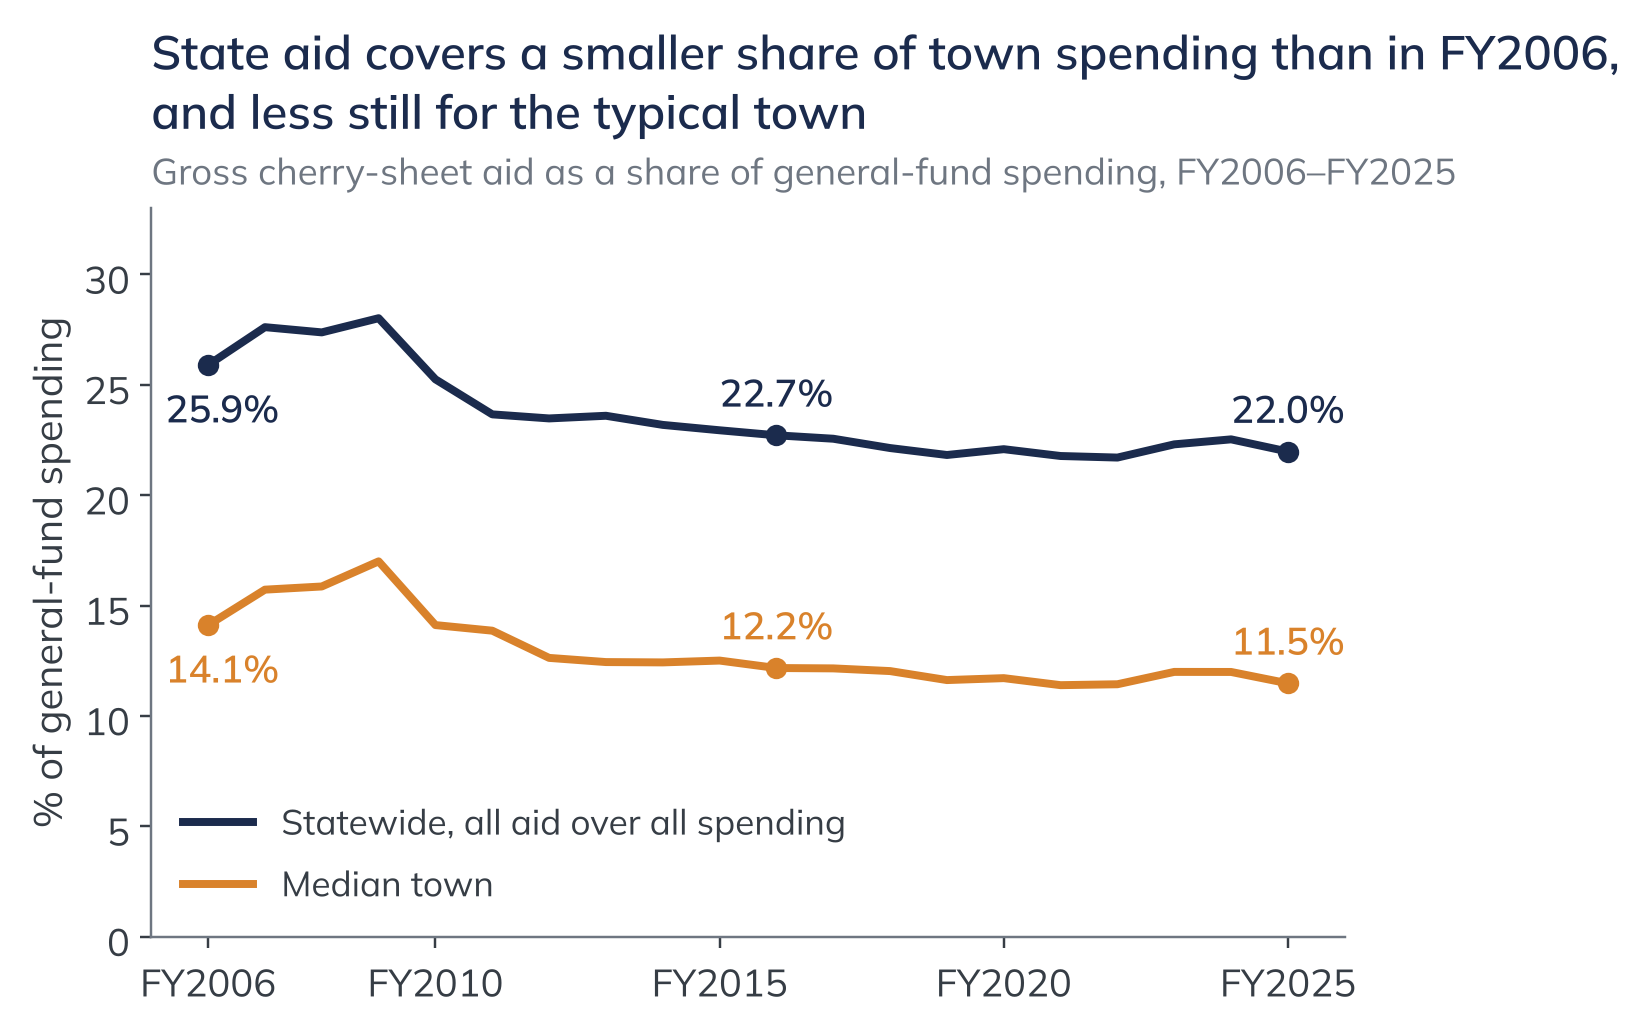
Schools and roads
Chart 15 of 16
School aid per pupil
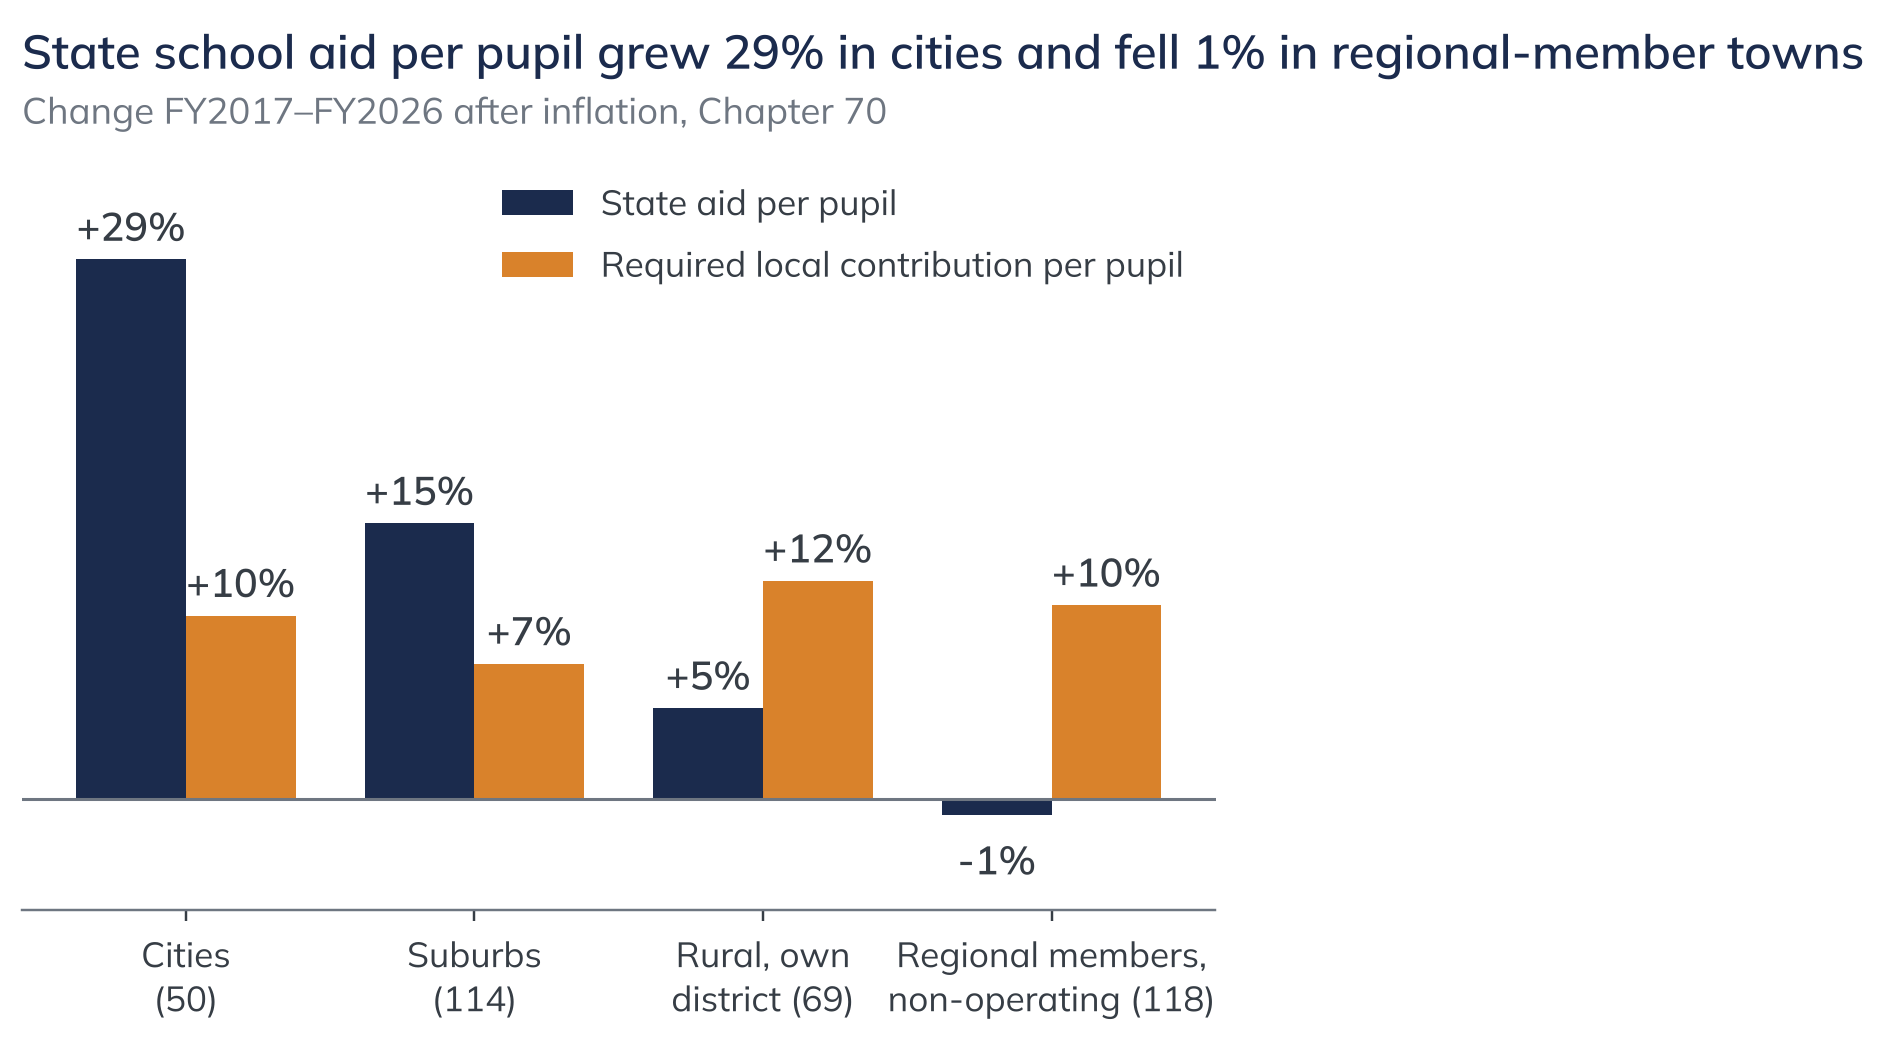
Chart 16 of 16
Road money not yet reimbursed
Chapter 90 money not yet reimbursed rose from $329 million in June 2019 to $674 million in June 2026, as the program grew from $240 million a year to $460 million.
Source: MassDOT Chapter 90 apportionments and CTHRU payments to cities and towns, FY2017–FY2026.
Massanomics turns large public records into findings people can use. How the work is done · Contact
Massanomics Weekly Every Tuesday
Your city or town, in the numbers that matter.
- This week’s story, with where your city or town stands
- Economics, housing and the state money that reaches you
- Land, climate, history and politics
- Side-by-side findings that show how it all connects