Section summary
On the Fairness Index, all state aid follows need and discretionary money follows size. The median all-aid score rises from 36 in the least needy fifth of towns to 59 in the neediest, largely through Chapter 70. On discretionary money the smallest fifth scores 91.5 at the median and the largest 36.6. Eighty-seven towns, home to 2.8 million people, stay low on both scopes under every weighting.
No single measure is the definition of fair. The Fairness Index puts four of them side by side for every town.
For each town it compares the state money the town received over ten years with what it would have received if the same pool had been divided on one measure alone:
- Equal: per resident.
- Need: residents weighted by poverty, income and property wealth, so a resident of the neediest town counts three times a resident of the least needy.
- Burden: each program divided by what it pays for, such as pupils for school aid, road miles for Chapter 90 and state-owned acres for the state-land payment.
- Effort: residents weighted by how much of their income goes to residential property tax.
A score of 50 means the town received exactly the share that measure would give it. Half the share scores 25 and double scores 75. The four scores are averaged at equal weight. The blend tracks the Equal lens closely (see Methods), which is why the four scores are shown separately here and on every town page. The index then tries every weighting with each measure between 10% and 40%, 231 in all, and flags a town only when its result holds under all of them.
There are two scopes. The headline covers all aid distributed through the state budget to the town and its school districts, state and federal: $93.1 billion over ten years, of which 9.6% is federal money passed through state appropriations. Formula aid is counted at its gross amount; competitive grants and enacted local earmarks to the city or town government are added. The second covers discretionary money only, the $2.52 billion in competitive grants and $0.21 billion in local earmarks to city and town governments.
All state aid follows need
On all aid, 229 of 351 towns score below 50, and the median is 43.4. That is arithmetic, not a deficit: expected amounts add up to the pool, so a smaller number of large cities well above their share balances a larger number of towns below it.
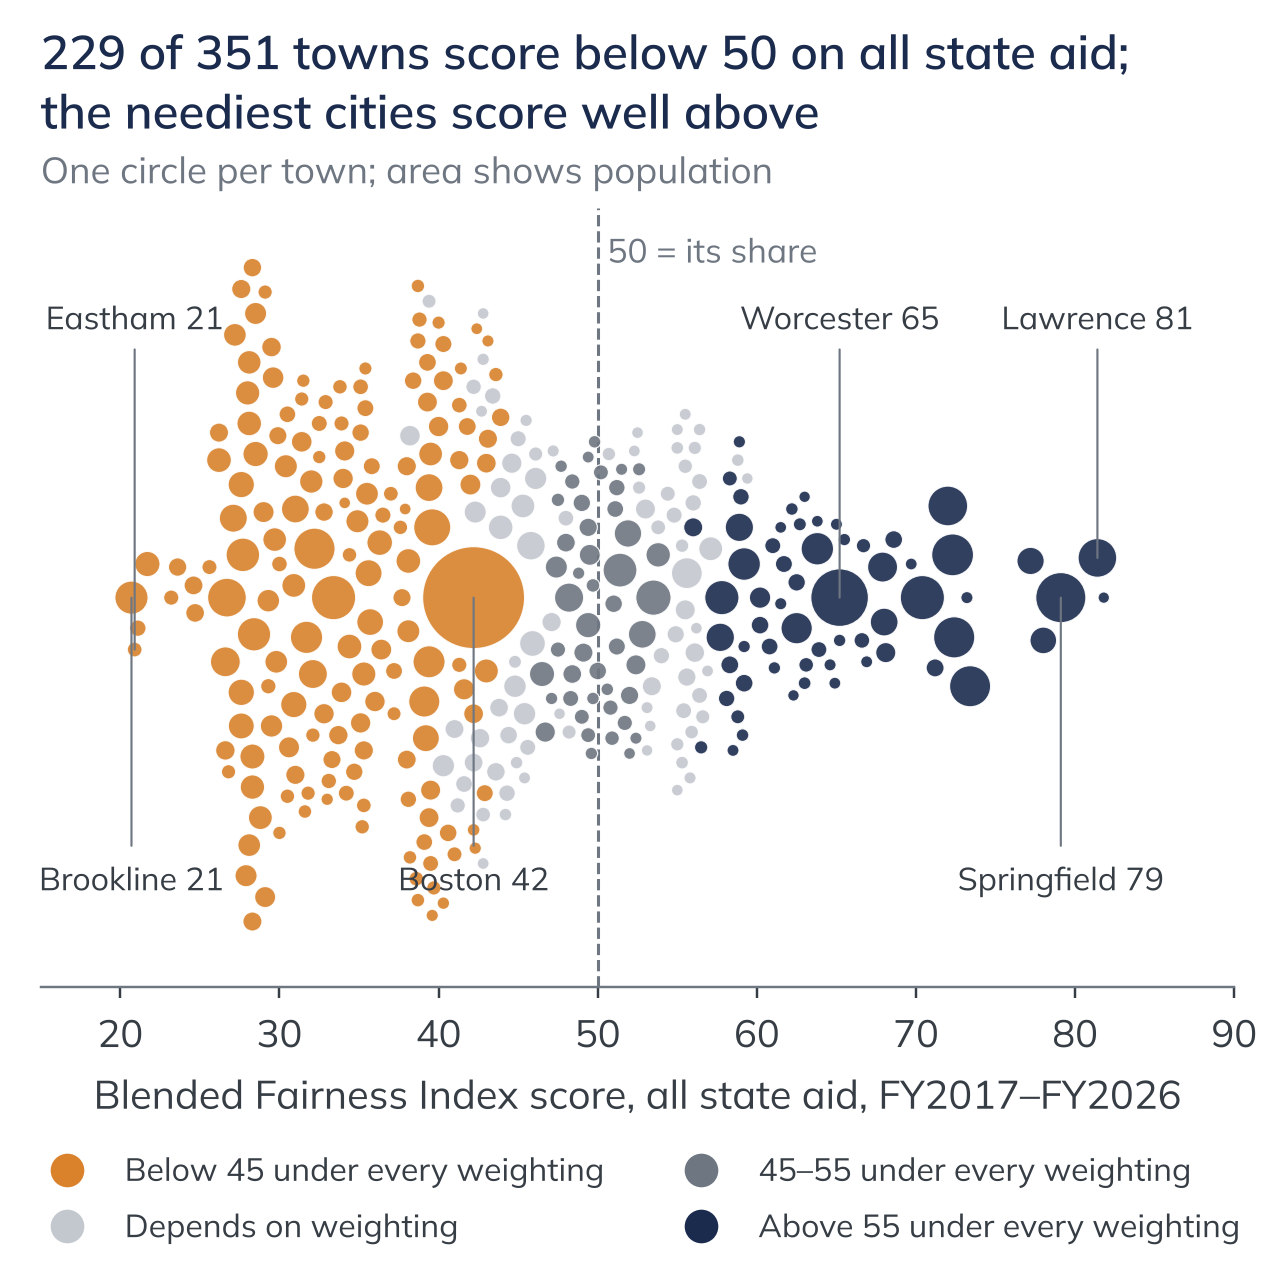
The result holds for most towns. Under every weighting tested, 162 towns stay below 45 and 61 stay above 55; 46 stay near 50, and 82 depend on the weighting. The 162 consistently low towns hold 55% of the state’s population.
The order follows need. The median score rises from 36 in the least needy fifth of towns to 59 in the neediest fifth. Lawrence (81), Springfield (79), Holyoke (78) and Chelsea (77) are near the top. Gosnold, with 31 residents, ranks first because $7.7 million over ten years is large against any population that small. The lowest include Cape Cod towns and affluent suburbs: Eastham (21), Brookline (21), Falmouth (22) and Chatham (23). This is largely the Chapter 70 formula doing what it was built to do. Gross Chapter 70 is 61% of the pool, and school programs together are 77%.
The four lens scores and the blend for the towns named in this section:
| Town | Equal | Need | Burden | Effort | Blend |
|---|---|---|---|---|---|
| Gosnold | 85 | 86 | 73 | 84 | 82 |
| Lawrence | 83 | 75 | 76 | 91 | 81 |
| Springfield | 83 | 74 | 76 | 83 | 79 |
| Holyoke | 80 | 71 | 77 | 84 | 78 |
| Chelsea | 81 | 73 | 74 | 81 | 77 |
| North Adams | 71 | 60 | 74 | 79 | 71 |
| Stockbridge | 35 | 45 | 45 | 44 | 42 |
| Chatham | 19 | 19 | 30 | 25 | 23 |
| Falmouth | 20 | 21 | 27 | 19 | 22 |
| Williamstown | 20 | 16 | 27 | 22 | 21 |
| Eastham | 20 | 20 | 28 | 15 | 21 |
| Brookline | 19 | 25 | 23 | 15 | 21 |
| Median, all 351 towns | 43.4 | 49.2 | 42.5 | 41.8 | 43.4 |
All state aid, FY2017–FY2026. 50 = the town’s share on that lens; the blend is the average of the four. Source: Massanomics analysis of DESE, DLS Municipal Databank, CTHRU and General Appropriations Acts data (the Fairness Index).
Discretionary money follows size
On discretionary money the order changes. The median score is 91.5 in the smallest fifth of towns and 36.6 in the largest. Under every weighting, 153 towns stay above 55 and 130 below 45. The lowest are Brookline (6), Seekonk (7) and Billerica (9), places that won little discretionary money for their size. This is the denominator problem of section 3 in another form.
| Town | Equal | Need | Burden | Effort | Blend |
|---|---|---|---|---|---|
| Stockbridge | 88 | 92 | 74 | 91 | 86 |
| Billerica | 8 | 12 | 8 | 8 | 9 |
| Rehoboth | 9 | 13 | 10 | 8 | 10 |
| Seekonk | 7 | 8 | 8 | 6 | 7 |
| Median, all 351 towns | 53.2 | 56.2 | 52.0 | 52.2 | 53.8 |
Discretionary money (competitive grants and earmarks to the city or town government), FY2017–FY2026. Source: Massanomics analysis of CTHRU statewide spending and General Appropriations Acts data (the Fairness Index).
Eighty-seven towns, home to 2.8 million people, stay low on both scopes under every weighting. Most are suburbs in Middlesex, Essex, Norfolk and Worcester counties.
The Berkshire picture
Berkshire County’s 32 towns have a median all-aid score of 50, against 43 statewide, and a median discretionary score of 87, against 54. On discretionary money 26 of the 32 stay above 55 under every weighting. On all aid the county splits: nine consistently high, eight consistently low, four near 50 and 11 dependent on the weighting. North Adams is highest (71). Williamstown is lowest (21, 349th), in part because the census counts its college students as low-income residents. Stockbridge scores 42 on all aid and 86 on discretionary money.
What the index cannot tell you
- Chapter 70 dominates the all-aid score. Without it, the blend correlates with the headline score at 0.69; both versions are in the file.
- Effort is the least settled measure. Five reasonable ways to measure it disagree, with rank correlations from −0.17 to 0.75. As built, it rises with residents’ income and with school spending above the required minimum (Methods).
- Regional Community Development Block Grant awards are paid to the lead town, which inflates the discretionary scores of towns such as Chesterfield, Truro, Shelburne and Russell.
- Census estimates count college students in population and poverty, which raises the need weight and lowers per-resident aid in Williamstown, Amherst and Northampton.
- Earmarks are enacted amounts, not payments.
- Ranks in the middle of the distribution are fragile: alternative methods move the median town 1 to 13 places and one town 156.
- A score says whether a town received its share of what the state spent. It does not say whether what the state spent was enough.