1 · Nature
24
state-listed species on record
9 of the 24 have been recorded since 2001. Shrewsbury has 10, Holden 13 and Grafton 8; the other 5 range from 5 to 11; Worcester is 99th most of 351.
Worcester County · Worcester
City · 207,055 residents · 37.4 square miles
State aid covers 49.1% of what Worcester spends, 12th highest of 346; Shrewsbury is at 15.4% and Holden 4.2%.
For five years I served on a select board, including as its chair. Every budget season brought the same question: what do we appropriate, and how much should we raise? It struck me that the data needed to make good decisions, and how it all related, was often lacking. I set out to create a space where, for every town in the Commonwealth, we could weave these threads together into a narrative that informs good decision-making. That’s what Massanomics provides: not just information on budgets, land, water, climate and disasters, but a coherent story drawn from the many public sources available.
For Worcester, that means 10.3 of 478.4 public road miles in the FEMA 1% flood zone, 289 National Register listings and $19.1 million in earmarks placed in the city.
Patrick White, former Chair, Stockbridge Select Board
Nature and money, in turn
1 · Nature
24
state-listed species on record
9 of the 24 have been recorded since 2001. Shrewsbury has 10, Holden 13 and Grafton 8; the other 5 range from 5 to 11; Worcester is 99th most of 351.
2 · Money
$19.1M
in local earmarks, ten state budgets
In ten enacted state budgets, FY2017 to FY2026, that is $92.28 per resident, 79th of 351. Shrewsbury had $988,000, Holden $315,000, Grafton $725,000 and Auburn $805,000 placed in them; the other 4 range from $165,000 to $1.1 million.
3 · Nature
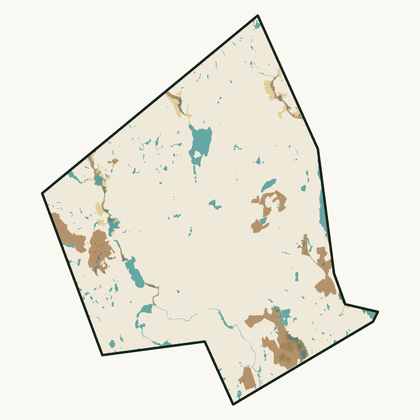
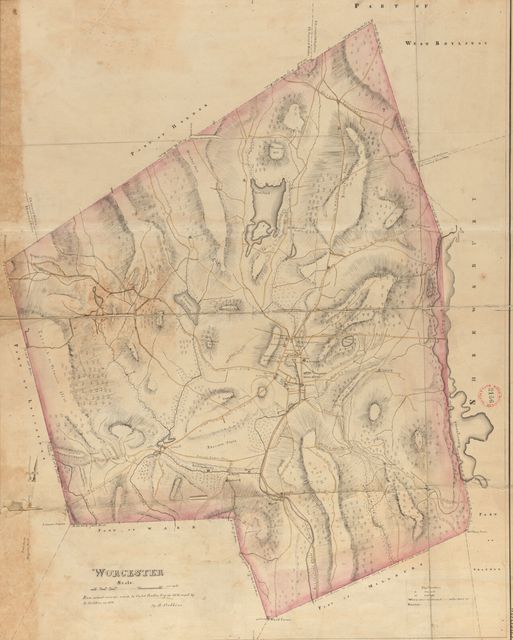
Woodland was 26% of the town in 1830 and is 14% now.
The 1830 figure is traced from the town’s plan, which under-records small woodlots; 14% is DCR’s 2021 satellite estimate.
Forest, 1971 to 1999: Worcester −21.2%, Shrewsbury −25.5%, Holden −8.5% and Grafton −8.8%; the other 5 range from −11.0% to −5.3%. Worcester is 298th of 351 (1 = most gained).
4 · Money
49.1%
of spending covered by state aid
The median town’s share is 11.5%. Shrewsbury is at 15.4%, Holden 4.2% and Grafton 20.0%; the other 5 range from 5.3% to 35.3%; Worcester’s is 12th highest of 346.
FY2025.
5 · Nature
7%
of the land is core habitat
That is 1,606 acres, 309th of 351 by share of land; the median town has 25%. Shrewsbury has 6%, Holden 19% and Grafton 8%; the other 5 range from 4% to 21%.
Worcester is a city of 207,055 people on 37.4 square miles of Worcester County, 5,542 to the square mile, among the most densely settled fifth of the state. Median household income is $70,000, below the median town’s $114,000, and 20% of residents are below the poverty line. State aid is a large part of its budget: it covered 49.1% of general-fund spending in FY2025, against 11.5% for the median town. On the Fairness Index it scores 65 for all state aid and 53 for discretionary money — above its share on all state aid, about its share on the money legislators and agencies choose to give. Its Land and Water Index is 18, 321st of 351. On the strong side: formula aid came to $19,940 per resident over ten years, 27th of 351; its Fairness score of 65 for all state aid is among the higher in the state (23rd of 351); Chapter 70 aid per pupil, after inflation, has risen 31% since FY2017.
Where it comes up short: 99% of its assessed lake acres and river miles are on the state’s impaired list — milfoil, low oxygen, nutrients; only 7% of its land is mapped core habitat; it lost 21% of its 1971 forest by 1999, more than eight towns in ten; the forest now covers about 22% of the city, down from the 26% the surveyors drew in 1830.
The openings are specific: 914 acres of core habitat, 57% of it, sit on land with no protection, the acreage state and land-trust programs exist to fund; $10.3 million of its Chapter 90 road money is apportioned and not yet drawn. The risks are equally specific: one of its bridges is rated poor and it owns 24 high- or significant-hazard dams; emerald ash borer has been mapped in city by the aerial survey since 2019.
The money
Worcester’s town government and school districts received $4.13 billion in formula aid and $80.2 million in competitive grants over ten years.
Fairness Index · all state aid
65 / 100
23rd of 351
Fairness Index · discretionary money
53 / 100
179th of 351
The land
Worcester has 1,606 acres of mapped core habitat, 7% of its land area; 914 of those acres are outside any protected land.
Habitat, forest and water ›Who represents Worcester
State House
John J. Mahoney
13th Worcester
State House
Daniel M. Donahue
16th Worcester
State House
Mary S. Keefe
15th Worcester
State House
David Henry Argosky LeBoeuf
17th Worcester
State House
James J. O'Day
14th Worcester
State Senate
Robyn K. Kennedy
First Worcester
and 2 more on the town page
To pass along
Nature
Worcester has 24 state-listed species on record, 99th most of 351; Shrewsbury has 10 and Holden 13.
Money
Worcester had $19.1 million in local earmarks placed in it over ten enacted state budgets, $92.28 per resident, 79th of 351; Shrewsbury had $988,000 and Holden $315,000.
History
Worcester’s town plan of 1830 is online at Digital Commonwealth, as are those of Shrewsbury and Holden; 291 of 351 towns have one.
This is your town, your city, the place you will spend these days of your life. The quality of that life depends on good decisions. I am a lifelong resident of Massachusetts and care deeply about this place. If we can be of service, write hello@parcenomics.com, or ask me to present to your board.
Sources: MassWildlife NHESP rare-species records by town, to 2025; MassWildlife BioMap 2022; MassGIS land use 1971–1999, USGS land cover 2001–2023 and DCR forest 2021; 1830 town plans, Massachusetts Archives, via Digital Commonwealth; Comptroller, Division of Local Services and DESE records through FY2026. Land layers as published 1 November 2026; money figures as built 3 November 2026. Every figure links to Worcester’s money page or Worcester’s land page.