1 · Nature
14
state-listed species on record
4 of the 14 have been recorded since 2001. Lynn has 16, Salem 16 and Danvers 13; the other 2 range from 16 to 20; Peabody is 184th most of 351.
Essex County · Peabody
City · 54,695 residents · 16.2 square miles
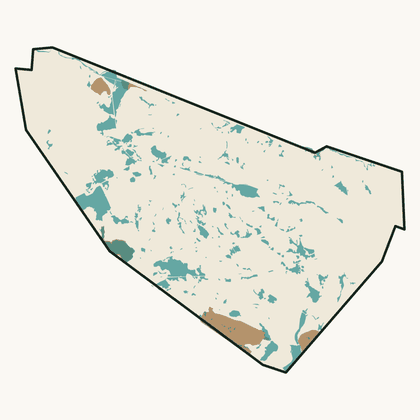
4% of Peabody’s land is mapped core habitat, 336th of 351; Lynn has 19% and Salem 5%.
For five years I served on a select board, including as its chair. Every budget season brought the same question: what do we appropriate, and how much should we raise? It struck me that the data needed to make good decisions, and how it all related, was often lacking. I set out to create a space where, for every town in the Commonwealth, we could weave these threads together into a narrative that informs good decision-making. That’s what Massanomics provides: not just information on budgets, land, water, climate and disasters, but a coherent story drawn from the many public sources available.
For Peabody, that means 4% core habitat, $124 per resident in competitive grants over ten years and relative sea level up 1.17 inches a decade at the Boston tide gauge.
Patrick White, former Chair, Stockbridge Select Board
Nature and money, in turn
1 · Nature
14
state-listed species on record
4 of the 14 have been recorded since 2001. Lynn has 16, Salem 16 and Danvers 13; the other 2 range from 16 to 20; Peabody is 184th most of 351.
2 · Money
$2.1M
in local earmarks, ten state budgets
In ten enacted state budgets, FY2017 to FY2026, that is $37.54 per resident, 210th of 351. Lynn had $8.9 million, Salem $7 million, Danvers $1.5 million and Lynnfield $1.9 million placed in them; the other 1 range from $323,000 to $323,000.
3 · Nature
−5.4%
forest, 2001 to 2023
Forest and woody wetland, satellite land cover. Lynn −3.2%, Salem −2.3% and Danvers −10.3%; the other 2 range from −9.4% to −4.1%. Peabody is 255th of 340 (1 = most gained).
4 · Money
23.2%
of spending covered by state aid
The median town’s share is 11.5%. Lynn is at 59.3%, Salem 22.3% and Danvers 10.9%; the other 2 range from 5.7% to 10.6%; Peabody’s is 72nd highest of 346.
FY2025. Chapter 70 school aid paid to the regional district is outside this share.
5 · Nature
4%
of the land is core habitat
That is 381 acres, 336th of 351 by share of land; the median town has 25%. Lynn has 19%, Salem 5% and Danvers 4%; the other 2 range from 27% to 39%.
Peabody is a city of 54,695 people on 16.2 square miles of Essex County, 3,369 to the square mile, among the most densely settled fifth of the state. Median household income is $97,000, below the median town’s $114,000. State aid is a large part of its budget: it covered 23.2% of general-fund spending in FY2025, against 11.5% for the median town. On the Fairness Index it scores 39 for all state aid and 20 for discretionary money — below its share on both. Its Land and Water Index is 25, 292nd of 351. On the strong side: Chapter 70 aid per pupil, after inflation, has risen 48% since FY2017.
Where it comes up short: measured against what it maintains, it received 34% of its proportional share of competitive grants; only 4% of its land is mapped core habitat; it lost 28% of its 1971 forest by 1999, more than nine towns in ten; the forest now covers about 22% of the city, down from the 24% the surveyors drew in 1830.
The openings are specific: its ten nearest peers’ median earmark per resident is $68.17 against its own $37.54, so towns like it do receive earmarks; $2.8 million of its Chapter 90 road money is apportioned and not yet drawn. The risks are equally specific: it owns six high- or significant-hazard dams.
The money
Peabody’s town government and school districts received $501 million in formula aid and $6.8 million in competitive grants over ten years.
Fairness Index · all state aid
39 / 100
228th of 351
Fairness Index · discretionary money
20 / 100
313th of 351
The land
Peabody has 381 acres of mapped core habitat, 4% of its land area; 322 of those acres are outside any protected land.
Habitat, forest and water ›To pass along
Nature
Peabody has 14 state-listed species on record, 184th most of 351; Lynn has 16 and Salem 16.
Money
Peabody had $2.1 million in local earmarks placed in it over ten enacted state budgets, $37.54 per resident, 210th of 351; Lynn had $8.9 million and Salem $7 million.
Forest
Peabody’s forest changed by −28.3% from 1971 to 1999, 329th of 351 (1 = most gained); Lynn −6.5% and Salem −18.3%.
This is your town, your city, the place you will spend these days of your life. The quality of that life depends on good decisions. I am a lifelong resident of Massachusetts and care deeply about this place. If we can be of service, write hello@parcenomics.com, or ask me to present to your board.
Sources: MassWildlife NHESP rare-species records by town, to 2025; MassWildlife BioMap 2022; MassGIS land use 1971–1999, USGS land cover 2001–2023 and DCR forest 2021; 1830 town plans, Massachusetts Archives, via Digital Commonwealth; Comptroller, Division of Local Services and DESE records through FY2026. Land layers as published 1 November 2026; money figures as built 3 November 2026. Every figure links to Peabody’s money page or Peabody’s land page.