Norfolk County · History
The history of Medway
Settled 1657 · incorporated 1713
Dates from the State Library of Massachusetts, “Cities and Towns of the Commonwealth of Massachusetts at 250,” which cites the Secretary of the Commonwealth. We read the page by machine and have not yet checked each date against it.
Population
How many people lived in Medway
Medway counted 785 people in 1765 and 13,115 in 2020.
Federal censusState census or provincial count
No accepted figure yet for 1900, 1910, 1920 and 1930.
- 1713: Established October 24, 1713, from part of Medfield.
- 1792: Boundary line between Medway and Sherborn (Middlesex County) established March 3, 1792.
- 1792: Part annexed to Franklin June 25, 1792.
The figures, where each comes from, and more notes
| Year | People | Kind | Source |
|---|---|---|---|
| 1765 | 785 | Provincial count | A |
| 1776 | 912 | Provincial count | B |
| 1790 | 1,035 | Federal census | C |
| 1800 | 1,050 | Federal census | D |
| 1810 | 1,213 | Federal census | E |
| 1820 | 1,523 | Federal census | F |
| 1830 | 1,756 | Federal census | G |
| 1840 | 2,043 | Federal census | H |
| 1850 | 2,778 | Federal census | I |
| 1855 | 3,230 | State census | J |
| 1860 | 3,195 | Federal census | K |
| 1865 | 3,219 | State census | L |
| 1870 | 3,721 | Federal census | M |
| 1875 | 4,242 | State census | N |
| 1880 | 3,956 | Federal census | O |
| 1885 | 2,777 | State census | P |
| 1890 | 2,985 | Federal census | Q |
| 1895 | 2,913 | State census | R |
| 1905 | 2,650 | State census | S |
| 1915 | 2,846 | State census | T |
| 1940 | 3,297 | Federal census | U |
| 1950 | 3,744 | Federal census | V |
| 1960 | 5,168 | Federal census | W |
| 1970 | 7,938 | Federal census | X |
| 1980 | 8,447 | Federal census | Y |
| 1990 | 9,931 | Federal census | Z |
| 2000 | 12,448 | Federal census | 26 |
| 2010 | 12,752 | Federal census | 27 |
| 2020 | 13,115 | Federal census | 28 |
- A. 1765 provincial census as printed in Census of the Commonwealth of Massachusetts 1905 Vol. I p. 854, county total for Norfolk 1765 reproduced exactly by town values
- B. 1776 provincial census as printed in Census of the Commonwealth of Massachusetts 1905 Vol. I p. 854, county total for Norfolk 1776 reproduced exactly by town values
- C. 1790 US census as printed in Census of the Commonwealth of Massachusetts 1905 Vol. I p. 854, county total for Norfolk 1790 reproduced exactly by town values
- D. 1800 US census as printed in Census of the Commonwealth of Massachusetts 1905 Vol. I p. 854, county total for Norfolk 1800 reproduced exactly by town values
- E. 1810 US census as printed in Census of the Commonwealth of Massachusetts 1905 Vol. I p. 854, county total for Norfolk 1810 reproduced exactly by town values
- F. 1820 US census as printed in Census of the Commonwealth of Massachusetts 1905 Vol. I p. 854, county total for Norfolk 1820 reproduced exactly by town values
- G. 1830 US census as printed in Census of the Commonwealth of Massachusetts 1905 Vol. I p. 854, county total for Norfolk 1830 reproduced exactly by town values
- H. 1840 US census as printed in Census of the Commonwealth of Massachusetts 1905 Vol. I p. 854, county total for Norfolk 1840 reproduced exactly by town values
- I. 1850 US census as printed in Census of the Commonwealth of Massachusetts 1905 Vol. I p. 854, county total for Norfolk 1850 reproduced exactly by town values
- J. 1855 state census as printed in Census of the Commonwealth of Massachusetts 1905 Vol. I p. 854, county total for Norfolk 1855 reproduced exactly by town values
- K. 1860 US census as printed in Census of the Commonwealth of Massachusetts 1905 Vol. I p. 854, county total for Norfolk 1860 reproduced exactly by town values
- L. 1865 state census as printed in Census of the Commonwealth of Massachusetts 1905 Vol. I p. 854, county total for Norfolk 1865 reproduced exactly by town values
- M. 1870 US census as printed in Census of the Commonwealth of Massachusetts 1905 Vol. I p. 854, county total for Norfolk 1870 reproduced exactly by town values
- N. 1875 state census as printed in Census of the Commonwealth of Massachusetts 1905 Vol. I p. 854, county total for Norfolk 1875 reproduced exactly by town values
- O. 1880 US census as printed in Census of the Commonwealth of Massachusetts 1905 Vol. I p. 854, county total for Norfolk 1880 reproduced exactly by town values
- P. 1885 state census as printed in Census of the Commonwealth of Massachusetts 1905 Vol. I p. 854, county total for Norfolk 1885 reproduced exactly by town values
- Q. 1890 US census as printed in Census of the Commonwealth of Massachusetts 1905 Vol. I p. 854, county total for Norfolk 1890 reproduced exactly by town values
- R. 1895 state census as printed in Census of the Commonwealth of Massachusetts 1905 Vol. I p. 854, county total for Norfolk 1895 reproduced exactly by town values
- S. 1905 state census as printed in Census of the Commonwealth of Massachusetts 1905 Vol. I p. 854, confirmed by 1915 state census Vol. Table 2 (1905 column)
- T. 1915 state census, Decennial Census of the Commonwealth 1915, Table 2 p. 51; county total for Norfolk reproduced exactly (Table 1 Recapitulation p. 48)
- U. 1940 US census as printed in 1960 Census of Population Vol. I Part 23 Table 7, confirmed by 1950 Census Vol. I Ch. 24 Table 6; county total reproduced exactly by town values; scan page images in work/ocr/pages (page number per cell not recorded)
- V. 1950 US census as printed in 1960 Census of Population Vol. I Part 23 Table 7, confirmed by 1950 Census Vol. I Ch. 24 Table 6; county total reproduced exactly by town values; scan page images in work/ocr/pages (page number per cell not recorded)
- W. 1960 US census, Census of Population Vol. I Part 23 (Massachusetts) Table 7; county total reproduced exactly by town values; scan page images in work/ocr/pages (page number per cell not recorded)
- X. 1970 Census figure as printed in 1990 CPH-2-23 Table 8 (pdf line 1409); "r" revision flags dropped
- Y. 1980 Census figure as printed in 1990 CPH-2-23 Table 8 (pdf line 1409); "r" revision flags dropped
- Z. 1990 Census figure as printed in 1990 CPH-2-23 Table 8 (pdf line 1409); "r" revision flags dropped
- 26. 2000 Census PL 94-171 P001001 (mageo.upl, ma00001.upl)
- 27. 2010 Census PL 94-171 P0010001 (mageo2010.pl, ma000012010.pl)
- 28. 2020 Census PL 94-171 P1_001N (mageo2020.pl, ma000012020.pl)
Boundary and establishment notes
- 1792: Boundary line between Medway and Frankhn established November 13, 1792.
- 1829: Boundary line between Medway and Holliston (Middlesex County) established and part of each town annexed to the other town March 3, 1829.
- 1832: Boundary line between Medway and Franklin established February 23, 1832.
- 1839: Part of Franklin annexed and boundary line established March 13, 1839.
- 1870: Part included in the new town of Norfolk February 23, 1870.
- 1885: Part estabUshed as Millis February 24, 1885.
Town boundaries changed over these years; each figure is for the town as that census counted it. A missing year is left blank, not estimated.
Counted separately
People the census counted apart
Benton’s 1754 return lists 7 enslaved persons aged 16 and over in Medway. The return counted only enslaved persons of that age and only towns that made returns; our reading of the column adds up 24 short of the 2,735 Benton prints for the Province, and we have not located the difference.
The 1850 census counted 0 “free colored” persons and 2,778 white persons in Medway, 0.0 percent of the town. “Free colored” is the federal schedule’s own category: slavery had ended in Massachusetts by court decision in the early 1780s, and the 1790 census recorded no enslaved people in the state.
The 1905 state census counted 8 persons the census recorded as “colored” (0.3 percent) and 1 Chinese (under 0.1 percent) among 2,650 people in Medway, and no Indian or Japanese persons.
| Year | Group | Persons | Share | Source |
|---|---|---|---|---|
| 1754 | Enslaved, 16 and over | 7 | A | |
| 1850 | Free colored (census term) | 0 | 0.0 percent | C |
| 1905 | Colored (census term) | 8 | 0.3 percent | D |
| 1905 | Chinese | 1 | under 0.1 percent | D |
Where these figures come from
- A. Benton, Early Census Making in Massachusetts, 1643–1765 (1905), the 1754 return, printed pp. 12–17 (this town: p. 12); archive.org earlycensusmakin00bent. Read from the page images by eye.
- C. Seventh Census of the United States, 1850, Massachusetts, Table II (printed pp. 50–52).
- D. Census of the Commonwealth of Massachusetts 1905, vol. I, “Color and Race,” by city and town; archive.org censusofcommonwe190501mass. The five columns add to the 1905 population.
Historic places
On the National Register
Medway has 3 listings on the National Register of Historic Places. The first was listed in 1988; the most recent in 2021. A district counts as one listing however many buildings it holds.
All 3 listings, by name (year listed)
- Evergreen Cemetery (2021)
- Medway Village Historic District (2008)
- Rabbit Hill Historic District (1988)
Historic places
In the state inventory
The Massachusetts Historical Commission’s inventory holds 427 records for Medway: 405 points (buildings, structures, objects and burial grounds) and 22 mapped areas. It records what has been surveyed. A low count means little of the town has been surveyed, not that little happened there. Archaeological sites are left out.
397 of the 405 points carry a construction date. By decade:
No resource in the inventory is dated before 1650.
The styles recorded most often:
- Greek Revival: 85
- Italianate: 75
- Federal: 44
- Colonial Revival: 18
- Victorian Eclectic: 13
Not counted as styles: 70 points marked “No style,” “Not researched” or “Altered beyond recognition.”
Maps
The town on the oldest maps
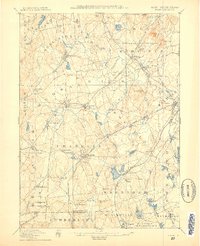
The oldest 15-minute (1:62,500) sheet from the U.S. Geological Survey that covers the center of Medway is the Franklin sheet, dated 1887 on the map, from a survey of 1887. 41 USGS map sheets of all scales and editions cover that point. A large town can fall on more than one sheet.
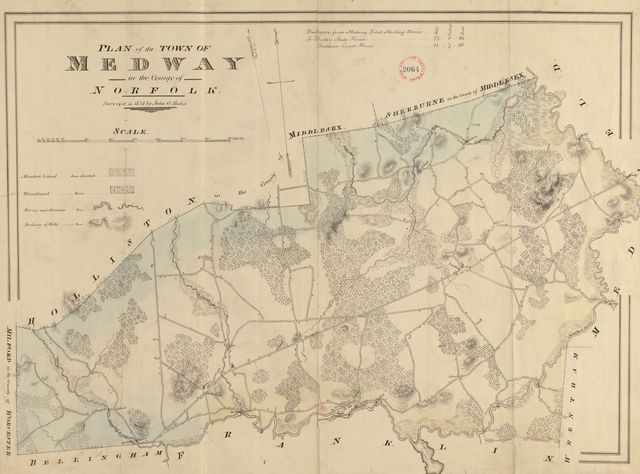
The state asked every town for a plan in 1830. Medway’s survives.
Reading room
Medway in its own books
1 vital-records volume and 1 town history for Medway, scanned by the Internet Archive and published before 1927. Each page opens beside its text, which you can search.
| Volume | Published | |
|---|---|---|
| Vital records of Medway, Massachusetts, to the year 1850 Vital records, Vol. 1, 1905 · 360 page images Published 1905. Internet Archive status: not in copyright. Not marked In copyright or access-restricted by the Internet Archive. Public domain by age (imprint 1926 or earlier) is our determination. | 1905 | Read On archive.org |
| The history of Medway, Mass., 1713-1885 Town history · 616 page images Published 1886. Internet Archive status: not in copyright. Not marked In copyright or access-restricted by the Internet Archive. Public domain by age (imprint 1926 or earlier) is our determination. | 1886 | Read On archive.org |
Names
Family names
Family names
187 surnames in Medway’s vital records
758 heading lines in the volumes to 1850, each linked to its page.
Open the names ›Next door
Neighboring towns
The towns that touch Medway:
Sources, rights and limits
- Settlement and incorporation. State Library of Massachusetts, “Cities and Towns of the Commonwealth of Massachusetts at 250,” citing the Secretary of the Commonwealth. State public record; no license stated. Read 6 November 2026; 199 of 351 towns compiled. Where it has no row we use the Secretary of the Commonwealth’s 1920 Historical Data Relating to Counties, Cities and Towns in Massachusetts (public domain by age).
- Population. U.S. Census Bureau and Massachusetts state censuses and provincial counts, public domain; the source of each figure is in the table above. Figures read from scanned tables were kept only where a printed county total confirmed them.
- National Register. National Park Service, National Register of Historic Places spatial data, queried 6 November 2026. U.S. government work, public domain. The layer is for general reference, and the Park Service withholds sensitive listings. Listings are placed in a town by the city in the listing, checked against the map point.
- State inventory. Massachusetts Historical Commission’s inventory (MACRIS data) as published by MassGIS, provided 4 June 2026. State data; no license stated. It does not substitute for review by the Commission. About 0.4% of points fall in a different town on our map than the layer names; we use the layer’s name.
- Maps. U.S. Geological Survey Historical Topographic Map Collection catalogue, 6 November 2026; USGS work, public domain. 1830 plans: Massachusetts Archives, via Digital Commonwealth.
- Scanned volumes. Internet Archive, with its OCR text. Volumes dated 1926 or earlier and not marked In copyright; public domain by age is our determination, not the Archive’s. Page numbers in the viewer are scan images, not printed pages.