|
Commonwealth Weekly Massanomics • Better Data, Better Decisions Volume 1 · Issue 1 · Tuesday, November 10, 2026 |
||||||
|
Welcome to the first Commonwealth Weekly, from Massanomics: a statewide website with pages for every one of Massachusetts’ 351 cities and towns, built from the public record. This is issue one. Tell us what would make it more useful: reply to this email. Explore your city or town and the other 350 cities and towns → |
||||||
|
|
||||||
|
Where the records meet Flood, fire, drought, outages:
|
|
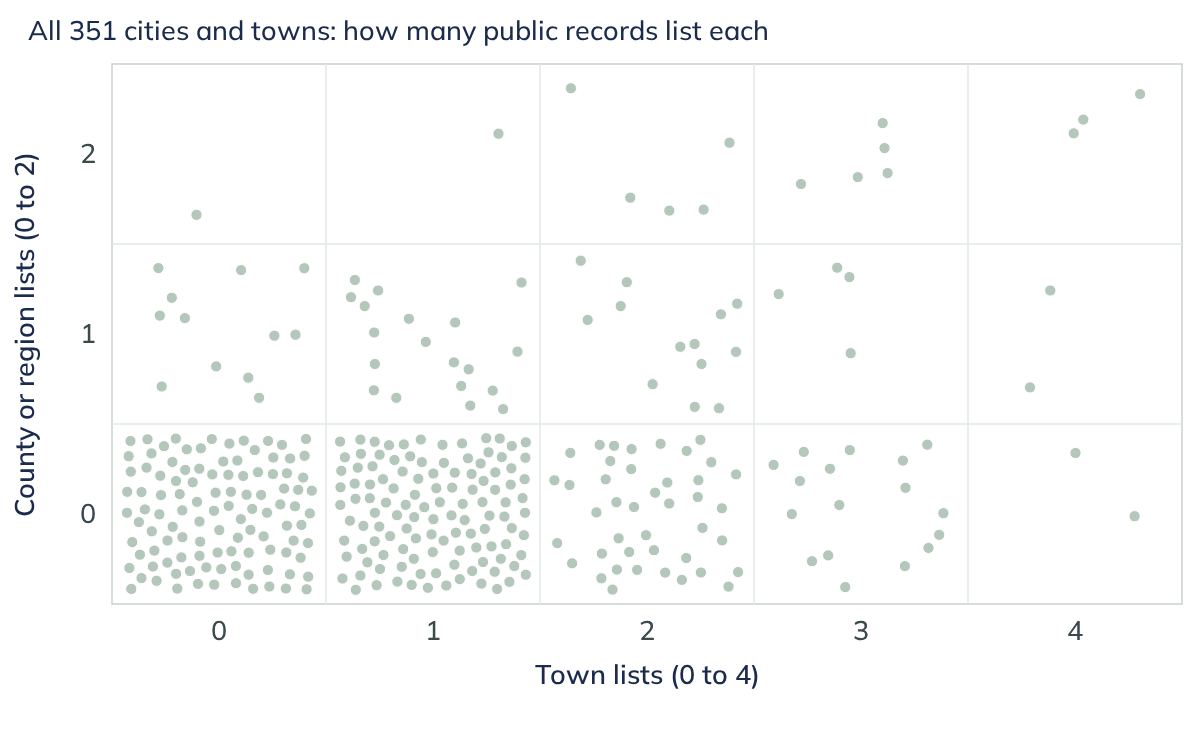
Floods, wildfire, poorly rated dams, drought and power outages each have their own public record, kept by a different agency. Few towns ever see them side by side. We put six of those records on one chart for all 351 cities and towns.
A town is on a list when it ranks in the top quarter of Massachusetts towns on that record; for dams, when the state has rated at least one high- or significant-hazard dam in town poor or unsatisfactory. Across the bottom (0 to 4) is how many of four town lists a town is on: roads in the FEMA flood zone, dams, wildfire and flood-insurance claims. Up the side (0 to 2) is how many of two regional lists cover it: drought, judged by state drought region, and power outages, judged by county.
Find your city or town on the finding page.
Most towns are on one list or none: 258 of 351. Seven are on all four town lists, from Barnstable to Westfield. The chart is not a risk score. It shows how many kinds of hazard turn up in a town’s record at once, and a town on several lists has several hazards competing for the same planning time and capital budget, and several cases to make for hazard-mitigation grants.
What it means for your city or town: its page for policymakers sets out strengths, weaknesses, opportunities and threats from its own record.
See where your city or town sits →
Your city or town’s own records: flood zone, dams, wildfire, drought, outages and disaster aid →
Economy this week
The Fed cut. Long-term borrowing got more expensive.
|
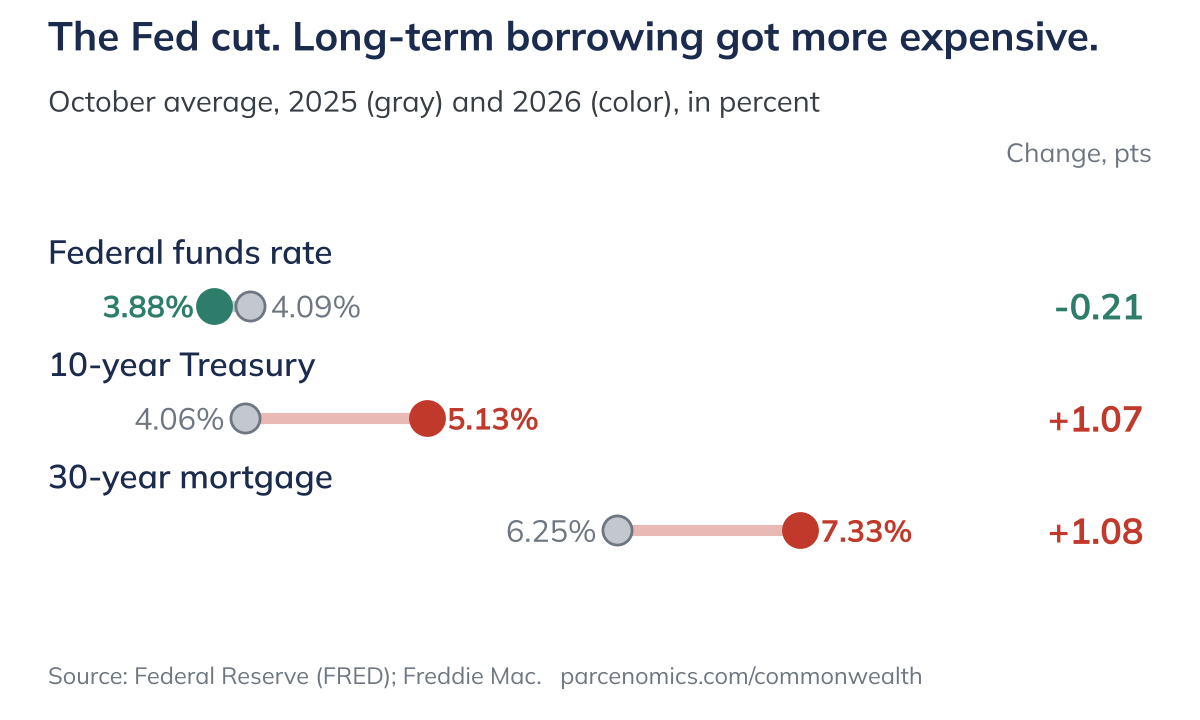
The Fed cut its benchmark rate, yet the 10-year Treasury and the 30-year mortgage each rose more than a full point in a year. Long-term rates drive what towns pay to borrow, and what homebuyers pay each month.
The federal funds rate averaged 3.88% in October, down from 4.09% a year earlier. Over the same year the 10-year Treasury climbed from 4.06% to 5.13%, and the 30-year mortgage from 6.25% to 7.33%. On a $500,000 loan, that is $359 more a month: $3,438 against $3,079, or about $4,300 a year in principal and interest. In a state already short of homes, higher rates squeeze buyers twice. Payments go up, and builders who finance construction face the same climb, which tends to slow new starts and tighten supply further. Towns feel it too, because long-term rates drive what they pay to borrow for a wastewater plant or a school roof.
Also this week. Jobs: Massachusetts unemployment fell to 4.3% in September from 4.6% a year earlier, partly because the labor force shrank by 59,536 people; employers reported 16,300 more payroll jobs. Prices: consumer prices were 3.7% higher than a year earlier. Beacon Hill: local bills for the Dalton fire district’s water commissioners, Pittsfield’s charter and the Dennis waterways fund became law.
Sea level
Boston’s sea is rising faster: now an inch every five years
Boston’s tide gauge shows the sea rising 3.0 millimeters a year over its full record, 1921–2025: roughly an inch every eight years, about a foot since the gauge began. Since 1990 it has risen 5.0 millimeters a year, an inch every five years. That means more destructive storm surges from higher water, and more flooding on calm days: NOAA expects Boston to see 11 to 19 days of high-tide flooding between May 2026 and April 2027. At today’s rate Boston would gain about nine inches from 2005 to 2050. NOAA’s 2022 scenarios put it at 11 to 18 inches, because they expect the rise to keep speeding up, and 19 to 75 inches by 2100. Coastal towns size culverts, seawalls and flood-zone rules for the water they expect.
See your city or town’s land, water and climate page using the land explorer here →
A note from the Massanomics Founder
This is your town, your city, the place you will spend these days of your life. The quality of that life depends on good decisions. I am a lifelong resident of Massachusetts and care deeply about this place. If we can be of service, write hello@parcenomics.com, or ask me to present to your board.
Patrick White, former Chair, Stockbridge Select Board
Your city or town on Massanomics
Who lives there and what stands out. |
State aid and earmarks against the budget. |
Habitat, protected acres, flood zone, climate. |
Population since 1765, old maps, Register listings. |

The legislators who represent it. |

Strengths, weaknesses, opportunities, threats. |
Every Massachusetts city and town has similarly structured pages. Explore the state →
See something wrong or missing on your city or town’s page? Reply and tell us; we correct the record.
Rare species
Our biggest endangered species? Six whales.
|
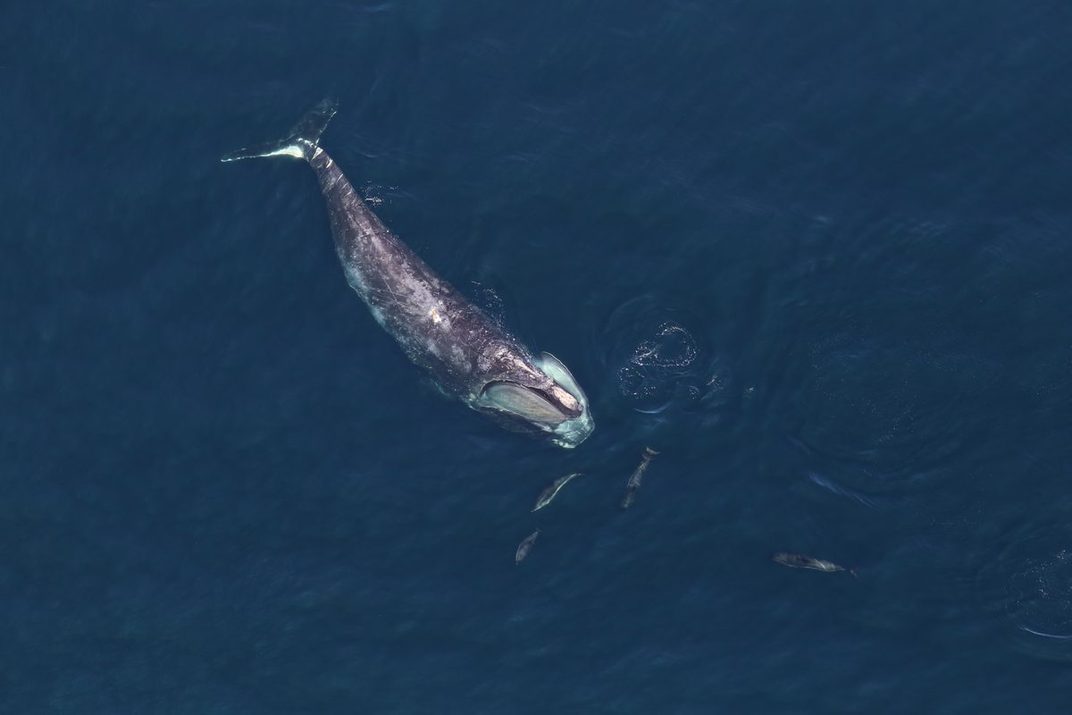
A North Atlantic right whale. Credit: National Marine Sanctuaries via Wikimedia Commons, public domain.
These majestic creatures aren’t just the stuff of lore and Moby-Dick. For time immemorial they have been staples of Massachusetts’ coastline. And they are threatened. All six are on the state’s endangered list: the North Atlantic right, sperm, blue, fin, humpback and sei whales. The right whale is down to about 384 (2024 estimate), and state records place it in 14 coastal towns. To give them room, state waters close to sink gillnets every January 15 to May 15.
Learn more about Massachusetts’ endangered species here →
|
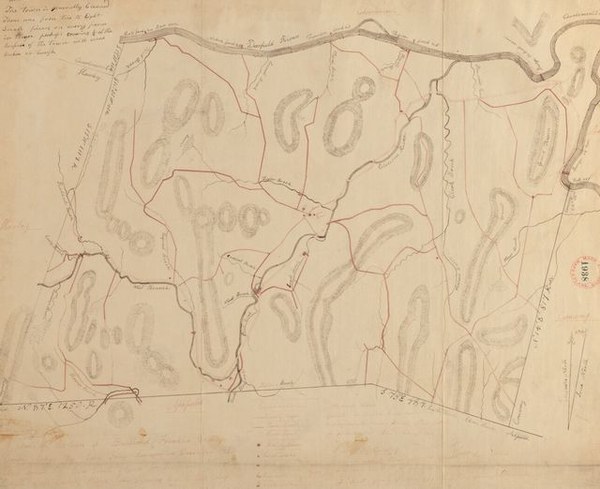
Plan of Buckland, made by John Tobey and dated December 1830. The town filed it for the statewide survey called for by the Resolve of 1829, at 100 rods to the inch. The town’s land page sets it beside the forest then and now. Credit: Massachusetts Archives, Town plans, 1830, via Digital Commonwealth; no known restrictions. Buckland’s land page →
Legislator Focus
Senator Joanne (Jo) Comerford
Hampshire, Franklin and Worcester District
In the current session, about to end, she is Vice Chair of Senate Ways and Means, Chair of the Joint Committee on Higher Education and Vice Chair of Senate Steering and Policy. Her cause is the formulas that send state money to towns: school aid, road money, payments for state-owned land. She says they were written without places like Hadley in mind. “We’ve been shortchanged for too long,” she told the Hadley Select Board on November 4, speaking of road money, as she pressed for state help with the town’s Connecticut River levee. Of her 249 lead bills since 2019, most went to the public health, environment and education committees; four became part of laws that passed. Her district runs from Amherst and Northampton to Athol and Winchendon.

|
A bald eagle, one of the rare species the state lists in Northampton, where she lives. Credit: U.S. Fish and Wildlife Service, Pacific Southwest Region, via Wikimedia Commons, public domain. Northampton’s land page →
Quote: Daily Hampshire Gazette, November 7, 2026 (the story). A bill’s topic is the committee it was first sent to for a hearing.
Her page, with posts, bills and votes →
Each of the nearly 200 members of the Legislature has a page: posts, bills, votes and campaign money. Find yours →
Municipal Focus
Nantucket: 87% of the island is core habitat, and 9.9 miles of public roads sit in the flood zone

|
Roseate terns, one of 99 rare species the state lists on Nantucket. Credit: U.S. Fish and Wildlife Service, Northeast Region, via Wikimedia Commons, public domain. Nantucket’s land page →
Nantucket has 25,763 acres of mapped core habitat, 87% of its land, fourth-highest of 351 (the median town: 25%); 11,064 acres are outside protected land. The state lists 99 rare species there, 72 recorded since 2001, among them the piping plover, roseate tern and green sea turtle. Four places are on the National Register, including Sankaty Head Light and Brant Point Light Station. The coastal climate division was 1.7 °F warmer in 1991 to 2020 than in 1951 to 1980. In the FEMA 1% flood zone lie 9.9 miles of public roads, Town Hall and the Sheriff’s office. The sea is rising here too: the island’s tide gauge shows 4.14 millimeters a year since 1965, an inch every six years. NOAA’s 2022 scenarios put Nantucket 13 to 19 inches higher than in 2005 by 2050 and 22 to 79 inches by 2100, and the state’s coastal model puts 24.7 miles of public roads in the flood zone by 2070. All 64 assessed lake acres are listed impaired.
Nantucket is one of 351. Explore your city or town and the rest of the state →
Featured finding
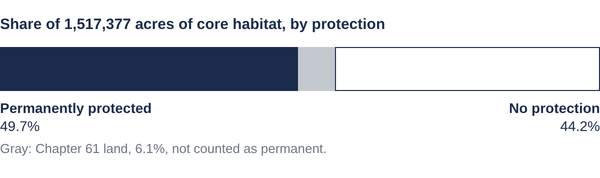
Half of the state’s core habitat has no permanent protection
|
BioMap core habitat covers 1,517,377 acres across the 351 cities and towns. Half of it, 50.3%, has no permanent protection: 671,401 acres with none and 92,432 acres of Chapter 61 land, a tax classification that is not permanent. The protected acres are held by the state (388,849), municipalities (140,055), land trusts and nonprofits (97,837), conservation restrictions (73,517), the federal government (50,202) and other holders (3,086). The finding page maps every town.
Photo highlights
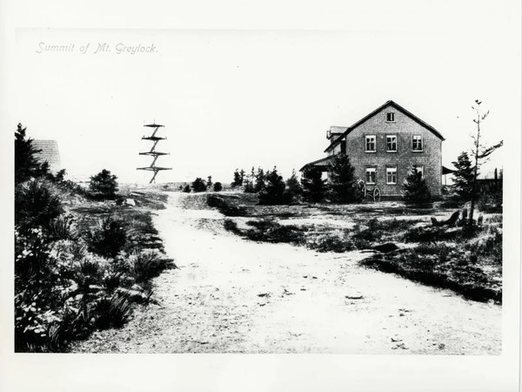
Mount Greylock summit, Adams, on a post card. Credit: Not credited on the print; National Register nomination, National Archives. |
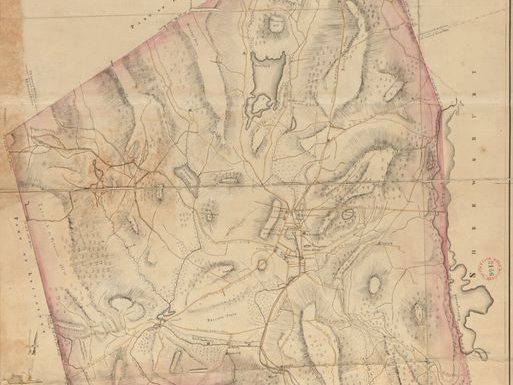
Plan of Worcester by Heman Stebbins, 1831 (detail). Credit: Massachusetts Archives, via Digital Commonwealth; no known restrictions. |
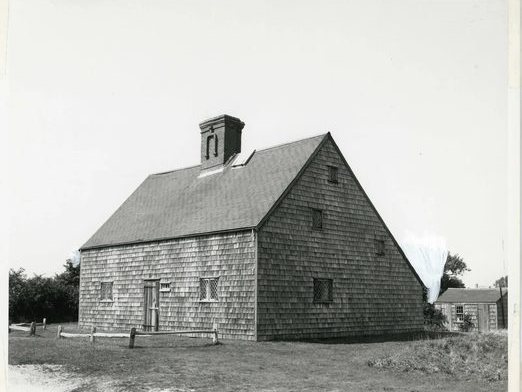
The Jethro Coffin House, Nantucket, in 1967. Credit: N.P.S.; National Register nomination, National Archives. |
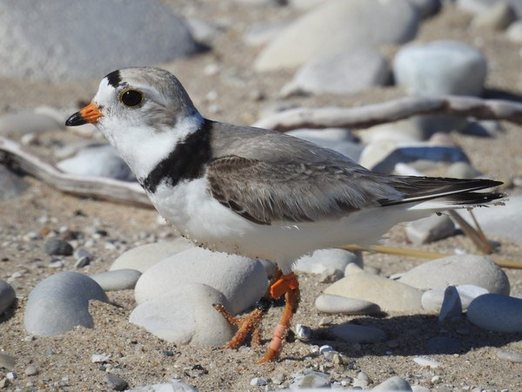
A piping plover in breeding plumage. Massachusetts had 1,193 nesting pairs in 2024. Credit: NPS photo, public domain. |
Next week
Winter has warmed fastest of the four seasons in Massachusetts, 4.0 °F per century since 1895 against 2.3 to 2.6 for the others. And another town unlike the rest, and another member’s record.
Explore all 351 cities and towns · Find your legislator · Feedback
What should we cover next? Reply; every message is read.
This is the email as sent on November 10, 2026, shown as it reads with no city or town on file. Sign up for Massanomics Weekly.
Write to hello@parcenomics.com to have an image removed.
Public records, public methods.
Massanomics · 81 Hawthorne St., Stockbridge, MA